bfinance insight from:

Peter Hobbs
Managing Director, Head of Private Markets

Jamie Duncan
Associate, Equities
The second quarter brought a spike of investor interest in REITs – quicker to crash than private real estate, due to the inevitable lag in illiquid asset write-downs, but with a history of strong post-crisis recovery. Recent months highlight major dispersion between different sectors, countries and active managers.
It is still too early to gauge the scale of the economic recession that will be caused by COVID-19. It is, however, highly likely that we will see a significant negative impact on real estate. Unemployment is rising, demand and net operating incomes are declining and investor appetite has stalled, particularly for weaker assets. Commentators anticipate the valuation impact to be between 5 and 30%, varying according to property type, sector and quality.
As usual, direct (private) real estate will be slow to show these falls: valuations are based on appraisals and we anticipate declines to occur between mid-2020 and 2022. Investors are anticipating the impact: we already see more redemption requests for open-end funds and slower capital raising for closed-end private real estate funds.
Rapid fall, muted recovery?
REITs, on the other hand, were among the first and hardest-hit asset classes. The March 2020 crash affected this sector even more severely than listed equities. It is typical for REITs to underperform public equity markets during bear markets, but this characteristic was perhaps exacerbated in the context of a health crisis that disproportionately affects sectors such as hospitality, tourism and retail, while also carrying potential long-term implications for themes such as office occupancy. Between the peak before the sell-off and the end of the first quarter (February 21st and March 31st), the FTSE/EPRA Nareit Index fell by 31.2% against the MSCI World’s 22.6% drop. By April, most REIT investors had marked down underlying real estate values by 15% - significantly lower than the extremely modest 2-5% falls being conceded by private real estate managers – and the REIT market was trading at a further 15% discount beyond that.
There has been a particularly rich period in terms of potential alpha generation
The subsequent weeks have brought a strong recovery in REIT pricing, although most are still showing substantial discounts versus December 2019, with the FTSE/EPRA Nareit Index returning -18.2% YTD (June 18th). In other words, many REITs do currently seem to offer attractive value versus direct real estate, although it is likely that volatility will persist over the coming months.
Alpha drivers
For investors considering exposure to REITs, the most overriding current theme is perhaps one of differentiation: differentiation between sectors (Figure 2), between countries (Figure 1) and between companies. As such, this has been a particularly rich period in terms of potential alpha generation. Yet on that point, again, differentiation is the watchword: while active strategies do typically outperform in this asset class, return dispersion is high. Manager performance is discussed further in the final part of this article.
1) Geographical differences
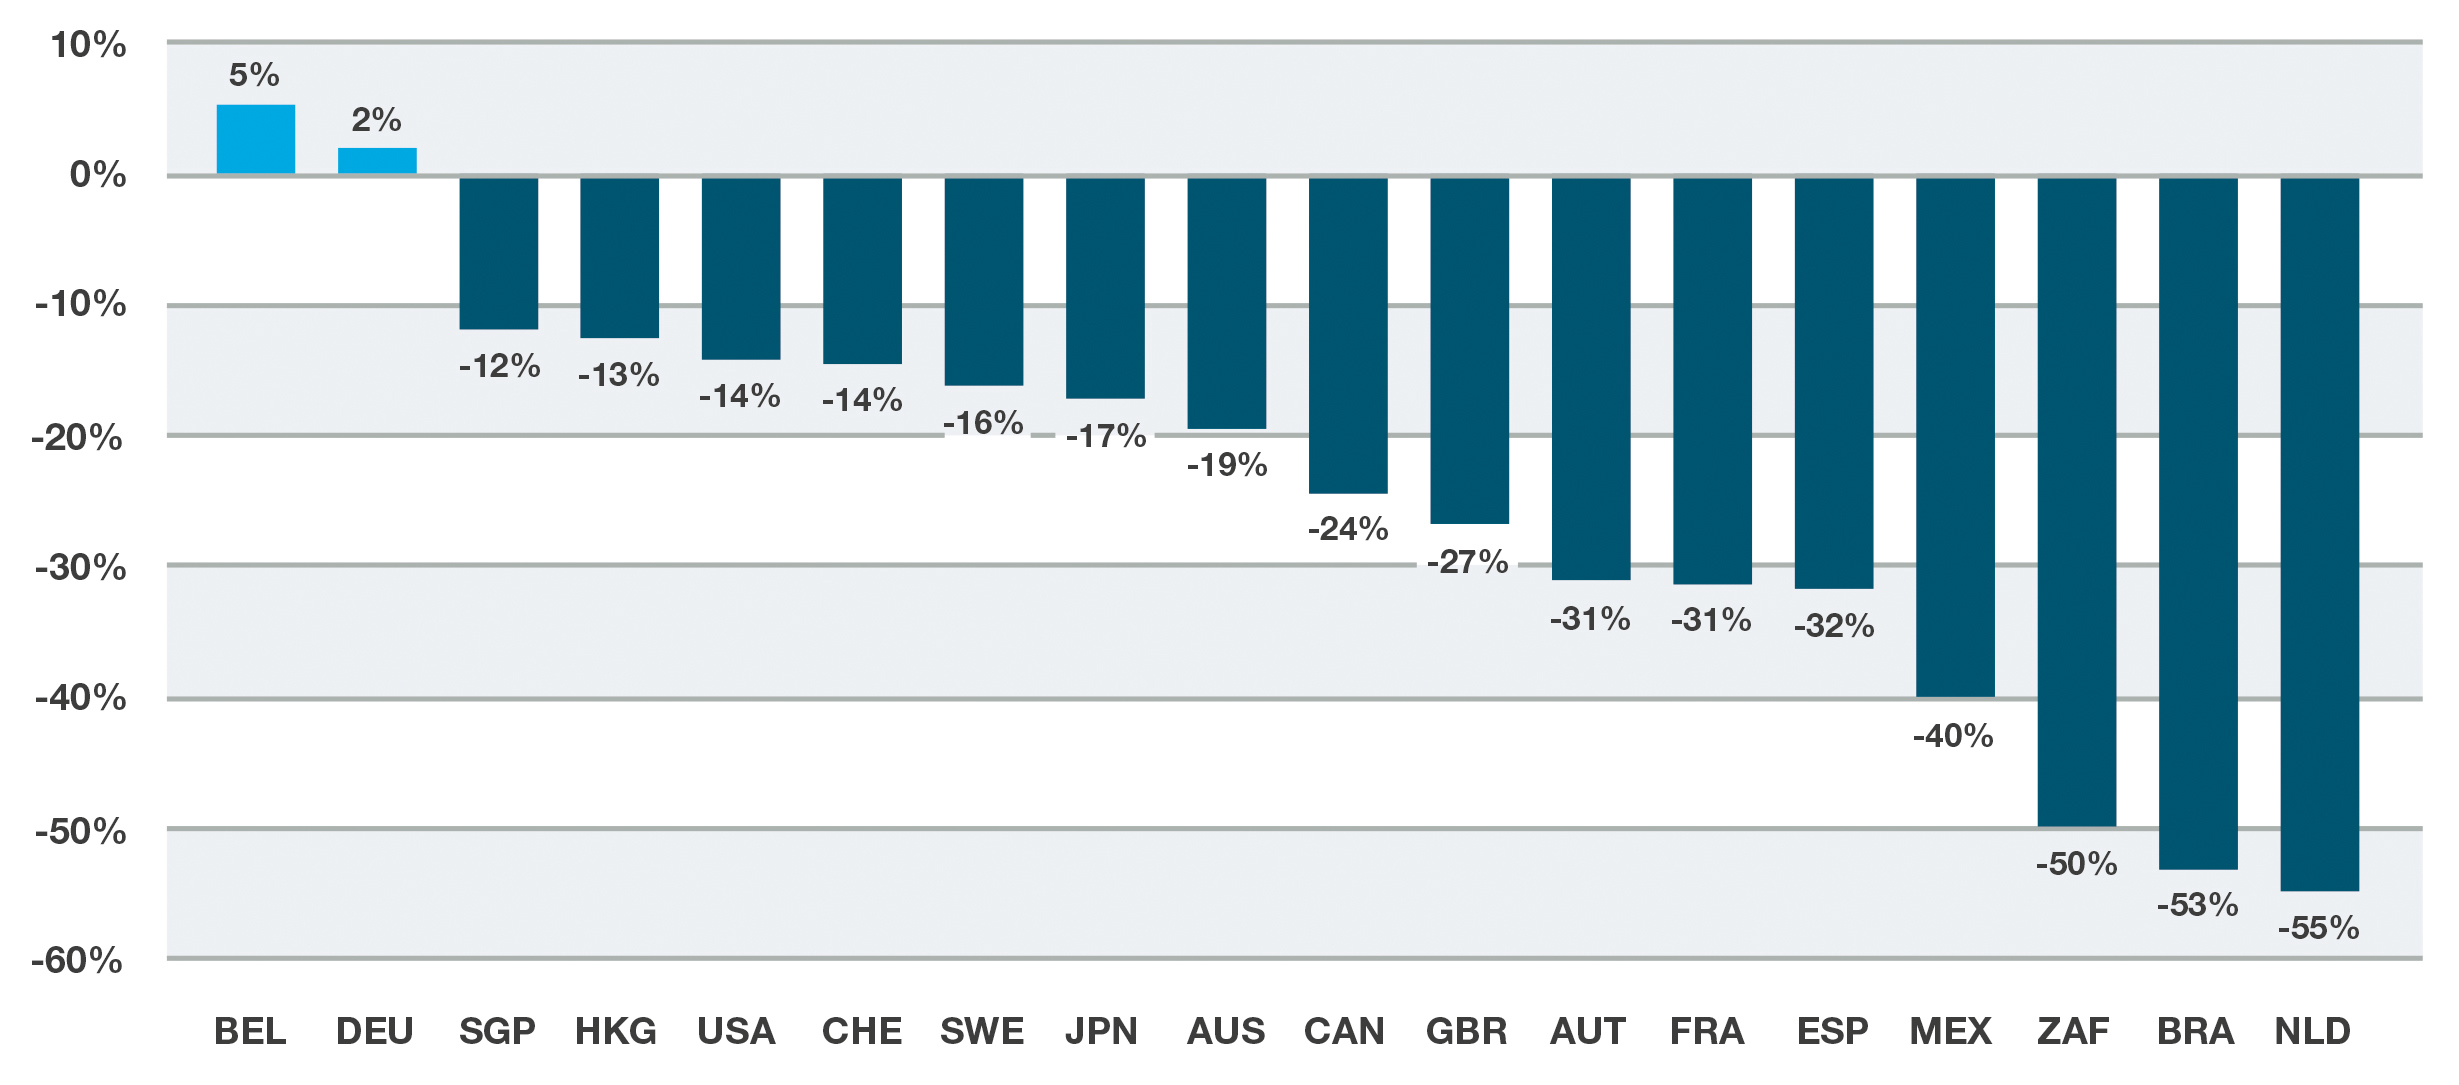
One of the most striking features of performance-by-country so far in 2020 is the huge variation among European markets, driven by a range of factors including sector orientation, response to COVID-19, economic impact to date and more. For example, the Belgium and Germany portions of the GPR 250 index (Figure 1) show gains of 5% and 2% respectively for 2020 YTD, while Netherlands has the weakest performance (-55%) and France and Spain are near the bottom of the pack. As in public equity markets, Asian REITs have typically outperformed international peers while those in commodity-oriented Emerging Markets (South Africa, Brazil) have struggled.
FIGURE 1: TOTAL GROSS RETURN OF GPR 250 YEAR-TO-DATE, AT JUNE 16TH 2020 (BY COUNTRY)

Source: GPR 250 Index. Note that some countries are represented by very few constituents (e.g. Mexico: 1).
2) Sector variation
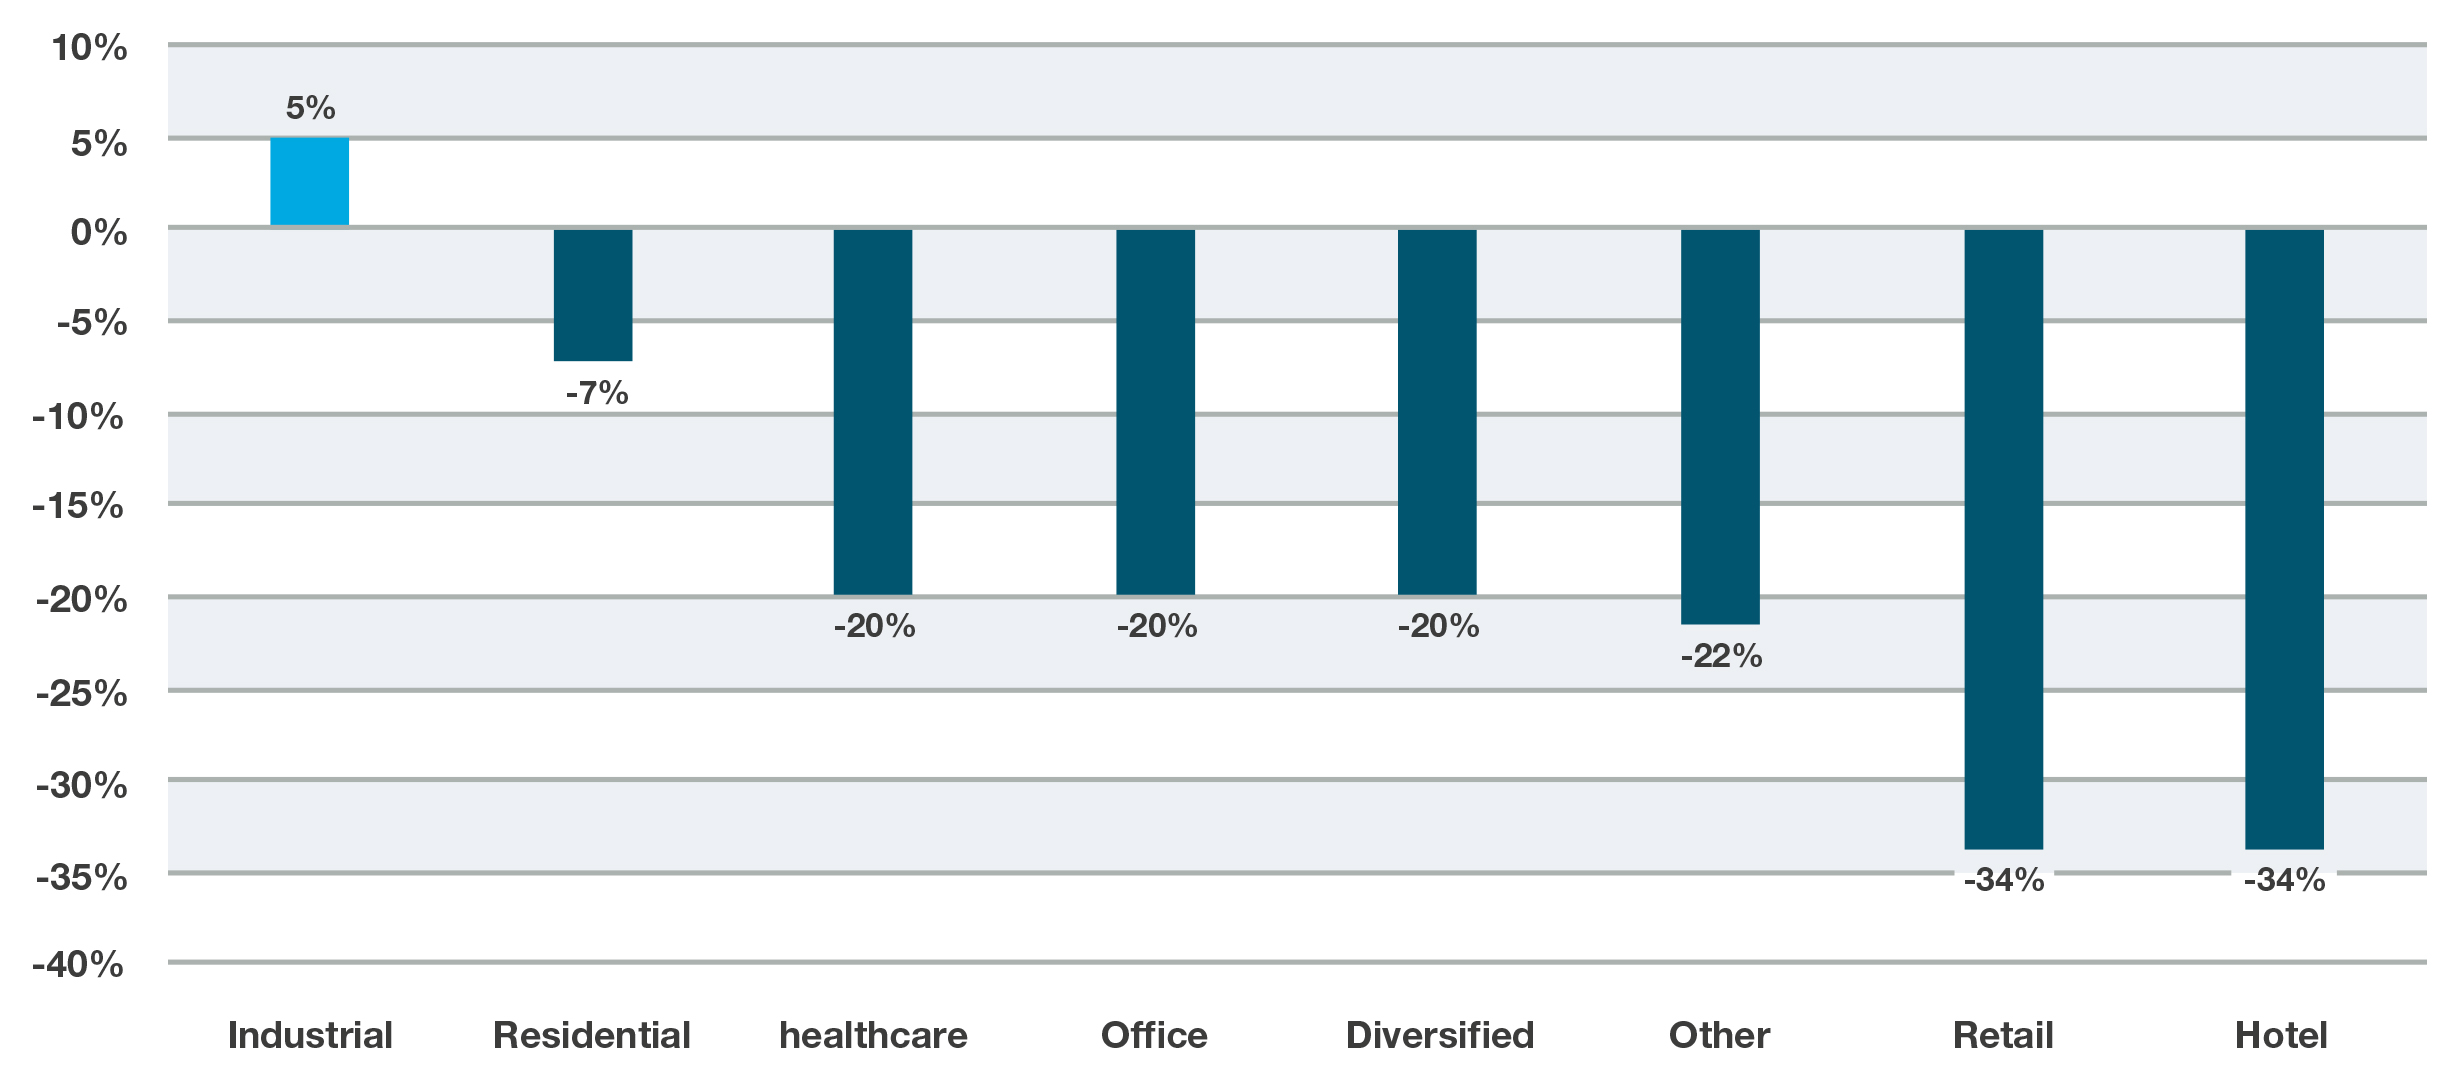
Sector-based differences are equally dramatic. The more resilient Industrial group which lost more than 17%, is now back in positive territory year-to-date, while harder-hit Retail and Hotels are still 34% in the red (Figure 2). Yet these high-level figures do mask substantial variation. For example, while retail was one of the worst-performing sectors, Malls and Shopping Centres suffered considerably more than other areas, while particular sub-sectors such as Data Centres and Self-Storage performed more strongly than Industrial.
FIGURE 2: TOTAL GROSS RETURN OF GPR 250 YEAR-TO-DATE, AT JUNE 16TH 2020 (BY SECTOR)

Source: GPR 250 Index
Lessons from asset manager performance
While most active REITs managers typically outperform their benchmarks (see: REITs Sector in Brief), there is a wide gulf between top and bottom performers. For example, while the median active manager has beaten the FTSE EPRA/NAREIT Developed index by 3.94% per year over the last three years (ending March 31st 2020), there’s a 17% gap between best and worst. Much of this divergence is the result of recent market developments: if we look just at the last year, the gap is around 30%.
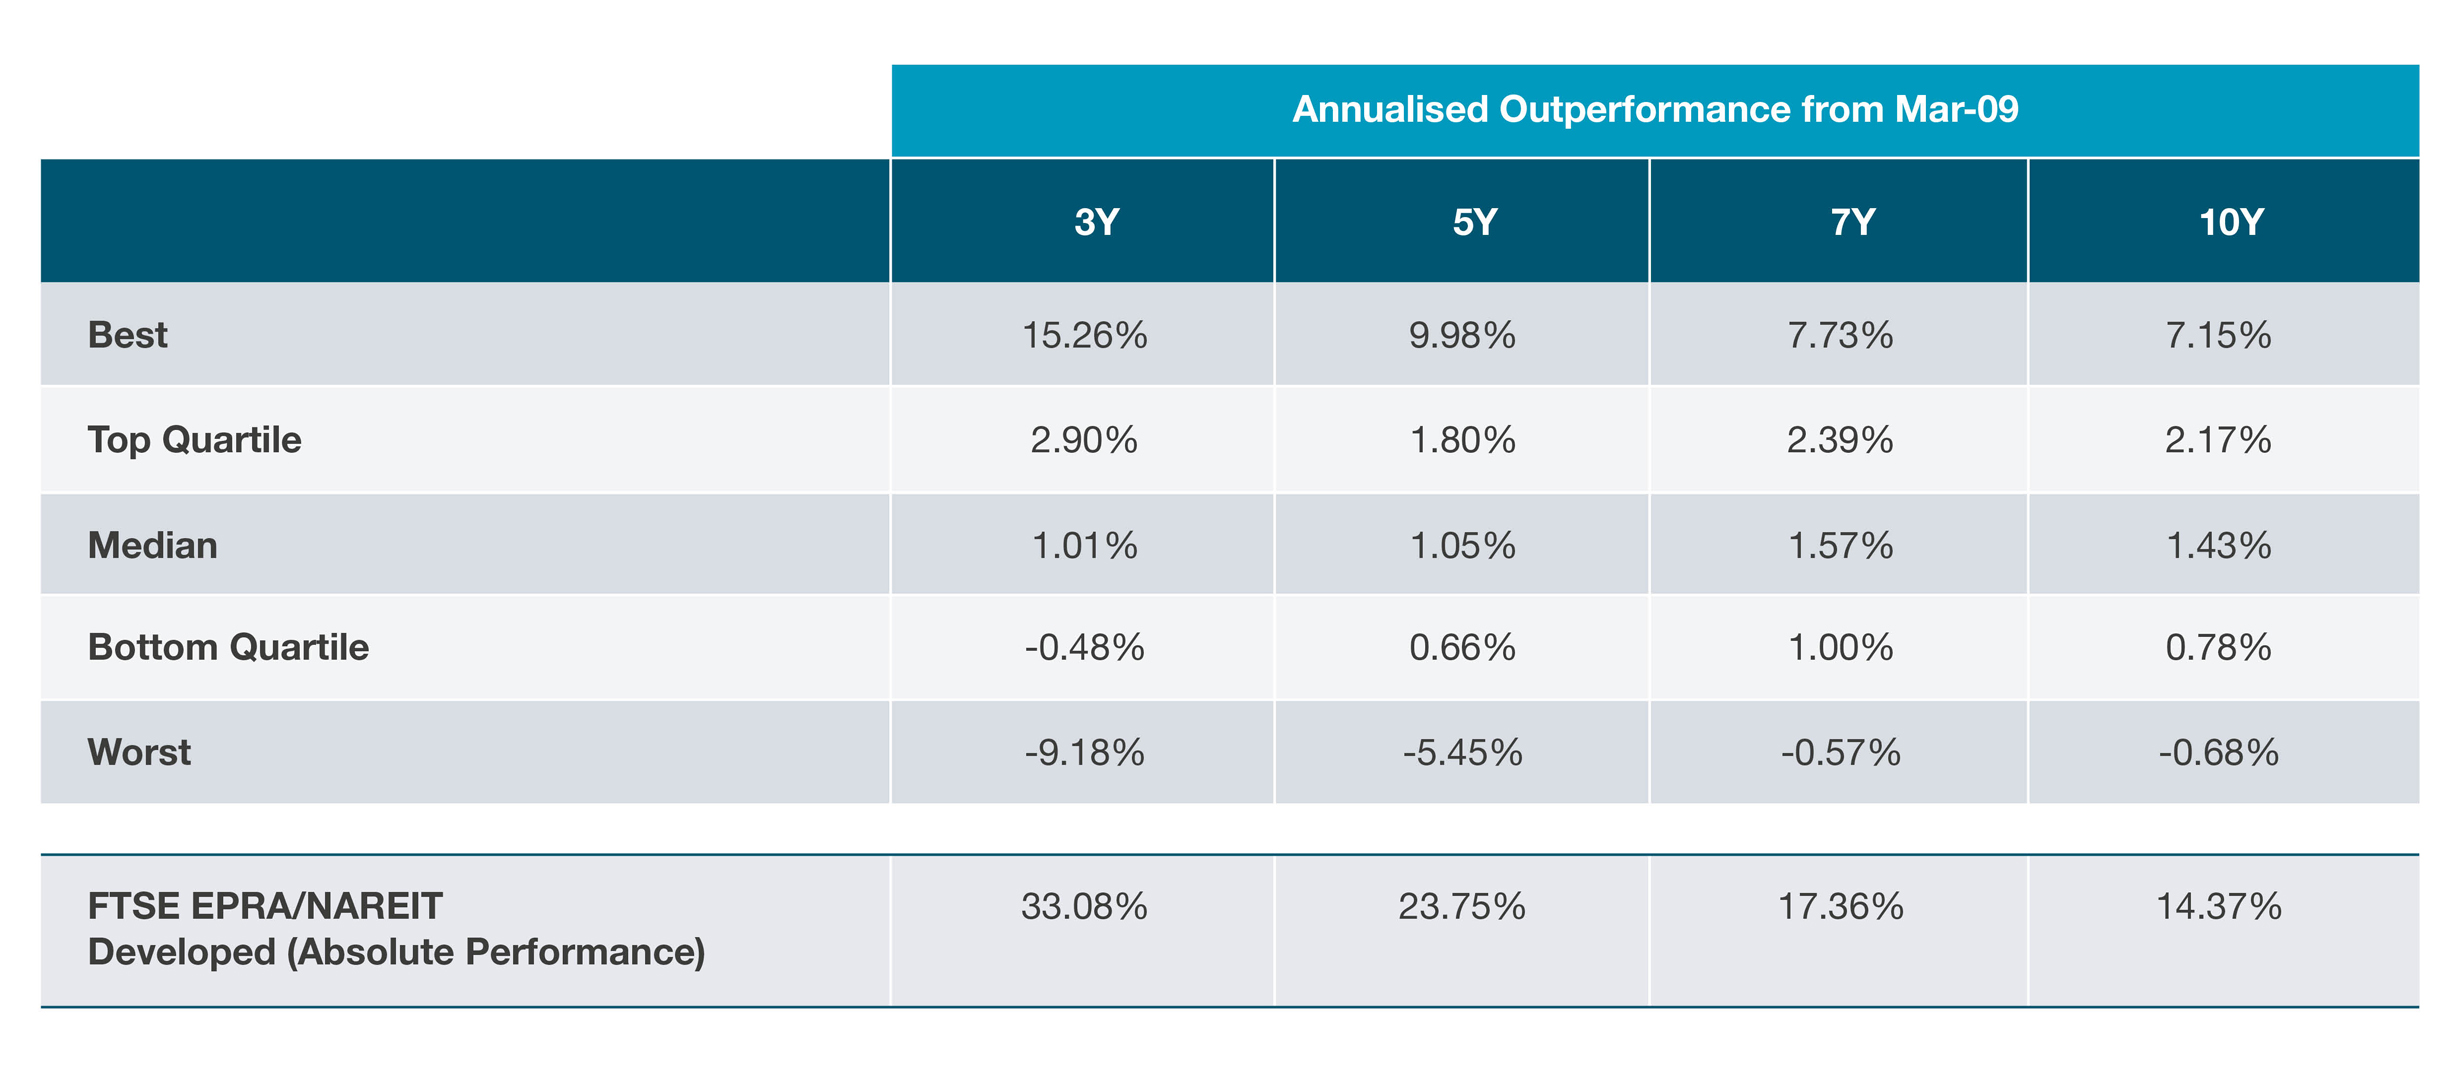
Indeed, if we look back at the post-GFC recovery, we note that performance dispersion appears to be particularly wide following a substantial downturn (Figure 3). In the three years following March 2009, for example, there was a gap of nearly 25% between the annualised results of the best and worst performers. At the ten-year mark, that gap had reduced to around 8%.
FIGURE 3: ANNUALISED OUTPERFORMANCE OF MANAGERS VS. FTSE EPRA/NAREIT AFTER THE FINANCIAL CRISIS

Source: eVestment. Data from 32 strategies, unhedged, before fees. Data showing 3-, 5-, 7- and 10-yr annualised outperformance all from March 2009. Data carries some survivorship bias.
While the COVID-19 crisis is of course fundamentally different in nature to the 2008 Financial Crisis, these figures are testament both to the alpha generation potential created by dislocated markets (with long-term outperformance of around 1.5% for the median and >2% for top quartile) and the varying ability of managers to exploit that potential.
Firm type and stability is particularly important during a period of stress, given the wave of corporate acquisition in the real estate industry.
When selecting managers, investors should pay close attention to key differences in manager approach. This should cover a range of factors including the individuals running mandates, the team and the organisation to the investment process. Firm type (e.g. independent boutique versus real estate manager versus global asset manager) and stability are important during a period of stress, particularly given the wave of corporate acquisition in the real estate industry. This organisational context also shapes the stability and tenure of the team, and the representativeness of track records. When looking at investment process, there are marked differences in the ways in which managers identify and exploit perceived mispricing of stocks.
It is also crucial to keep a sharp eye on costs, with management fees ranging from as little as 30bps through to 100bps (median 70bps), and the potential to negotiate fees down to the lower end of that range (e.g. 40-50bps), even for the best quality managers.
Navigating uncertainty
A rising tide can indeed lift all boats. Yet now certainly not the time for a passive or careless approach to REITs, notwithstanding what may seem – on a relative basis at least – to be attractive valuations. This is especially true in light of the uneven revivals seen in Q2 and the prospect for further volatility over coming quarters. As the COVID-19 crisis progresses and the true implications for the real estate market become clearer, we expect strong active managers to benefit from the numerous dislocations created by excessive fear and excessive confidence.
Important Notices
This commentary is for institutional investors classified as Professional Clients as per FCA handbook rules COBS 3.5R. It does not constitute investment research, a financial promotion or a recommendation of any instrument, strategy or provider. The accuracy of information obtained from third parties has not been independently verified. Opinions not guarantees: the findings and opinions expressed herein are the intellectual property of bfinance and are subject to change; they are not intended to convey any guarantees as to the future performance of the investment products, asset classes, or capital markets discussed. The value of investments can go down as well as up.


 English (Global)
  Deutsch (DACH)
  Italiano (Italia)
  Dutch (Nederlands)
  English (United States)
  English (Canada)
  French (Canada)

