bfinance insight from:

Martha Brindle
Director, Equity

Sarita Gosrani
Director, ESG & Responsible Investment

Ahmed Mohamoud
Associate, Equity
Investors are placing ever-greater focus on the carbon intensity of their investments, with equity portfolios often first in line for implementation. Yet, while carbon commitments can represent a positive step within a broader ESG agenda, applying reductions in an overly simplistic way can lead to problematic consequences—undermining both investment-related goals and environmental ones.
This article is the second instalment in a three-part series. Part 3—Feeling the Heat? Taking the Temperature of Equity Portfolios—can be viewed here.
Reducing portfolio carbon intensity is an objective that is now fully ensconced within the investment mainstream for pension funds, endowments and many other types of asset owner. In equity allocations, this objective is often expressed via hard or soft targets for internal and external asset managers—typically involving a desired Weighted Average Carbon Intensity (WACI) that is lower than the reference benchmark. Such targets would have been a passing rarity just three years ago.
These goals and their implementation vary greatly from investor to investor. Some are looking for reporting first and foremost, supported by recent improvements in data availability, with a view to informing possible future reductions. Some set loose objectives around reduced emissions; others have firmer targets at the level of the total equity portfolio and/or the underlying mandates, and may even hard-code those requirements into an Investment Management Agreement (IMA). A sizeable minority are cognisant of carbon figures but are also focused on forward-looking climate objectives; if we consider the equity manager searches conducted by bfinance over the past twelve months, for example, one third of investors with a carbon-related intention also had a ‘Net Zero’ agenda. These differences can be related to extrinsic drivers as well as intrinsic ones, such as parameters set by local regulators.
There is no ‘one-size-fits-all' answer in a space where investors bring very different priorities to the table. Thoughtful implementation, however, is always essential. In this piece, we focus on three potential pitfalls that investors can encounter when cutting carbon: a restricted manager universe, sub-optimal or unintended investment outcomes, and undermining ‘climate’ objectives. Afterwards, we set out three practical questions that investors should address during implementation, with a view to minimising missteps.
Pitfall 1: A restricted manager universe
Not all active equity managers are willing to deliver carbon reduction targets, whether in their ‘flagship’ funds or in customised separate accounts. While it should theoretically be possible to create a portfolio with a lower carbon footprint in almost any type of strategy, the reality is more complex. In practice, an overly strict target can and (as we have seen) does constrain the potential universe of equity strategies available to investors.
Importantly, managers’ willingness to deliver portfolios with relatively low carbon intensity—and the extent to which doing so will affect their investment results—varies by ‘style’. In order to explain this point, Figure 1 shows the weighted average carbon intensity (WACI) of strategies within bfinance’s global equity style composites. This type of assessment currently tends to rely heavily on Scope 1 and 2 data (an issue discussed further below).
Figure 1: Weighted Average Carbon Intensity (Scope 1 and 2) across global equity strategies, by investment style
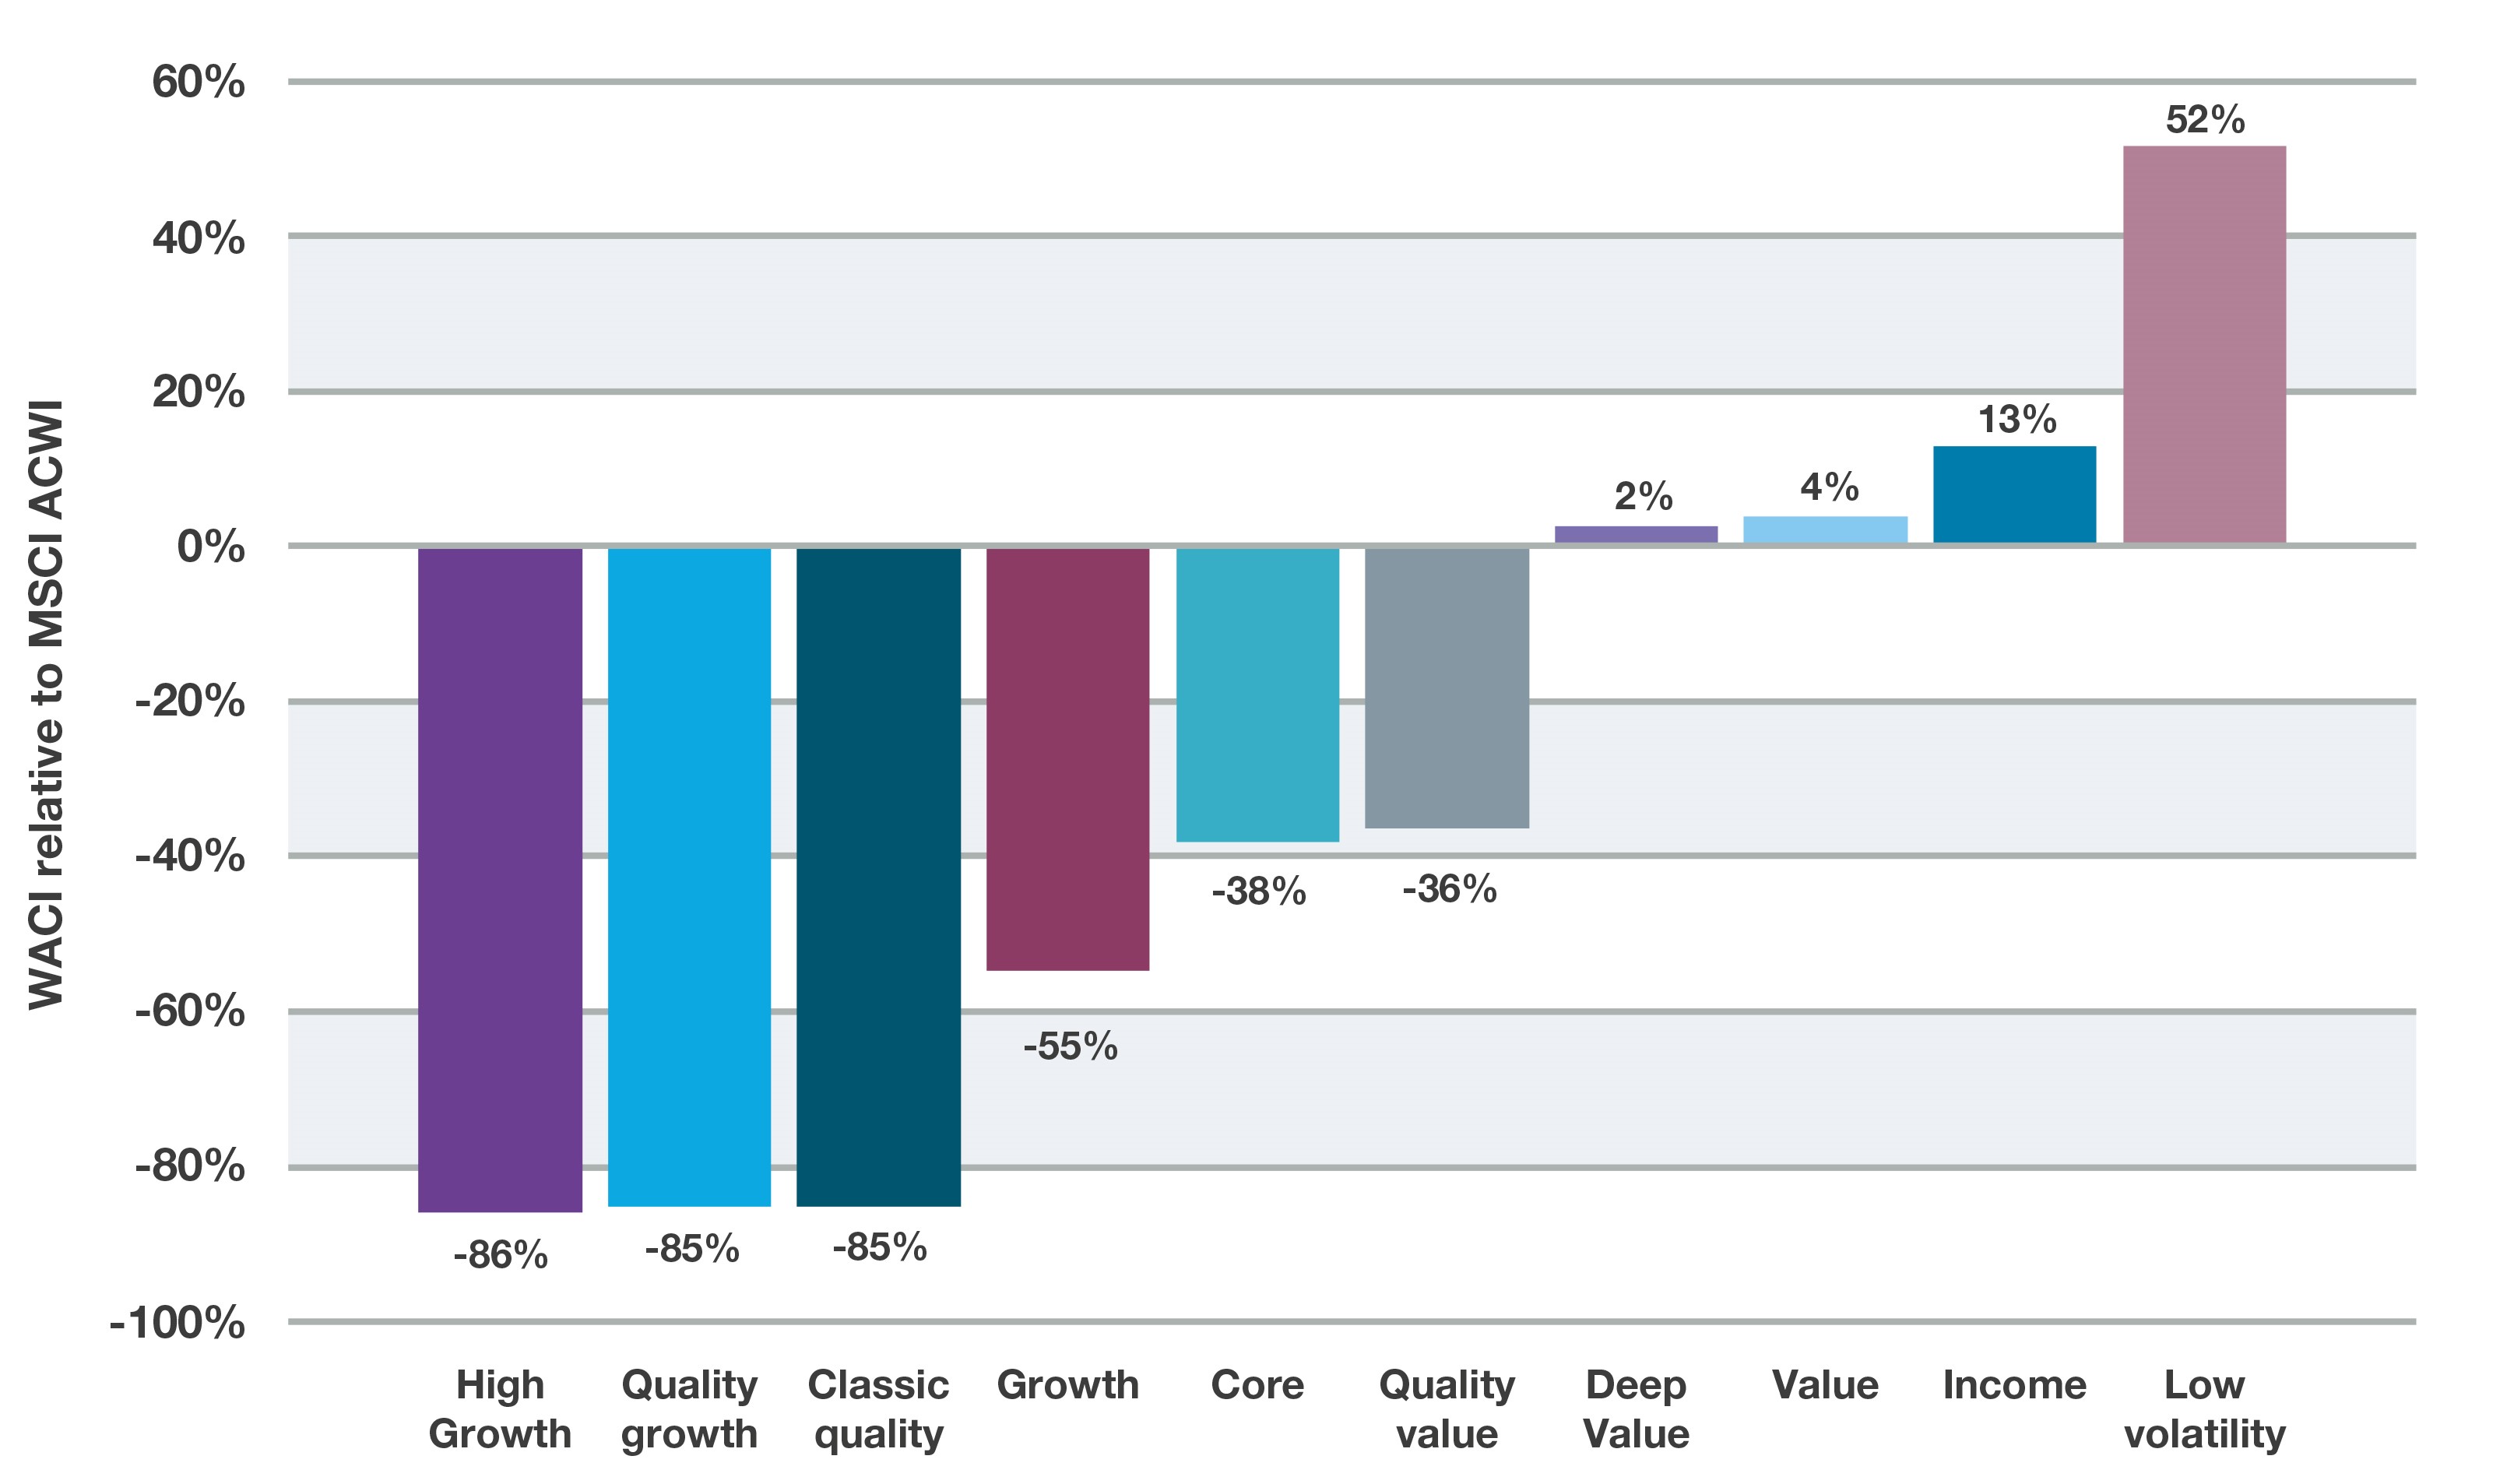
Source: bfinance, Style Analytics, Sustainalytics. bfinance global equity style composites (featuring actively managed strategies that are highly representative of the named styles) and MSCI ACWI. Data correct at March 2022. Weighted Average Carbon Intensity (WACI) is a measure of the Scope 1 and 2 carbon emissions of portfolio companies relative to the revenue of the companies, aggregated based on their weight in the portfolio.
Many of the differences shown in Figure 1 are attributable to typical sector and industry biases prevalent across managers in these styles. For instance, Low Volatility and Income strategies typically hold overweight positions to Utilities companies (see Defensive Equities and Market Downturns. Classic Quality and Quality Growth strategies, on the other hand, tend to be strongly biased towards IT. (‘Pitfall 2’ takes a closer look at carbon emissions by sector/region and considers the importance of Scope 3 data.)
Investors should be aware of the diversity of manager approaches: the median figures shown here mask considerable dispersion between strategies. We find particularly large differences in the amount of dispersion in the WACI data for Low Volatility and Quality Value strategies, whereas High Growth and Quality Growth strategies are more homogeneous.
It is also helpful to be aware of managers’ willingness to adapt in practice. Low Volatility managers, for example, may have outsized average WACI figures but the systematic nature of most strategies makes it relatively straightforward to adjust portfolio construction parameters to deliver a customised portfolio for investors. Even where customisation is possible, investors will still have to judge whether it is desirable: a higher degree of tailoring can have an impact on structure (separate account versus pooled fund), mandate size (minimum needed for a separate account) and the representativeness of the manager’s track record.
When thinking about WACI figures, it’s worth remembering that various relevant bodies—including the TCFD—are urging investors to avoid an overly-blinkered focus on WACI and ensure that they also have an awareness of other relevant statistics, such as overall CO2 emissions. Because of the way that revenues are factored into WACI calculations, large or increasing revenues can give a misleading impression of low or improving emission intensity. As such, Figure 2 shows the absolute emissions associated with the same types of equity strategy, placed in the same order in which they were presented in Figure 1—showing some significant differences in the output. While we again see a clear bifurcation between growth-oriented and value-leaning approaches, this calculation shows a somewhat more favourable picture for Low Volatility and a considerably less attractive one for Value.
Figure 2: Total CO2 emissions (Scope 1 and 2) of global equity strategies, by investment style
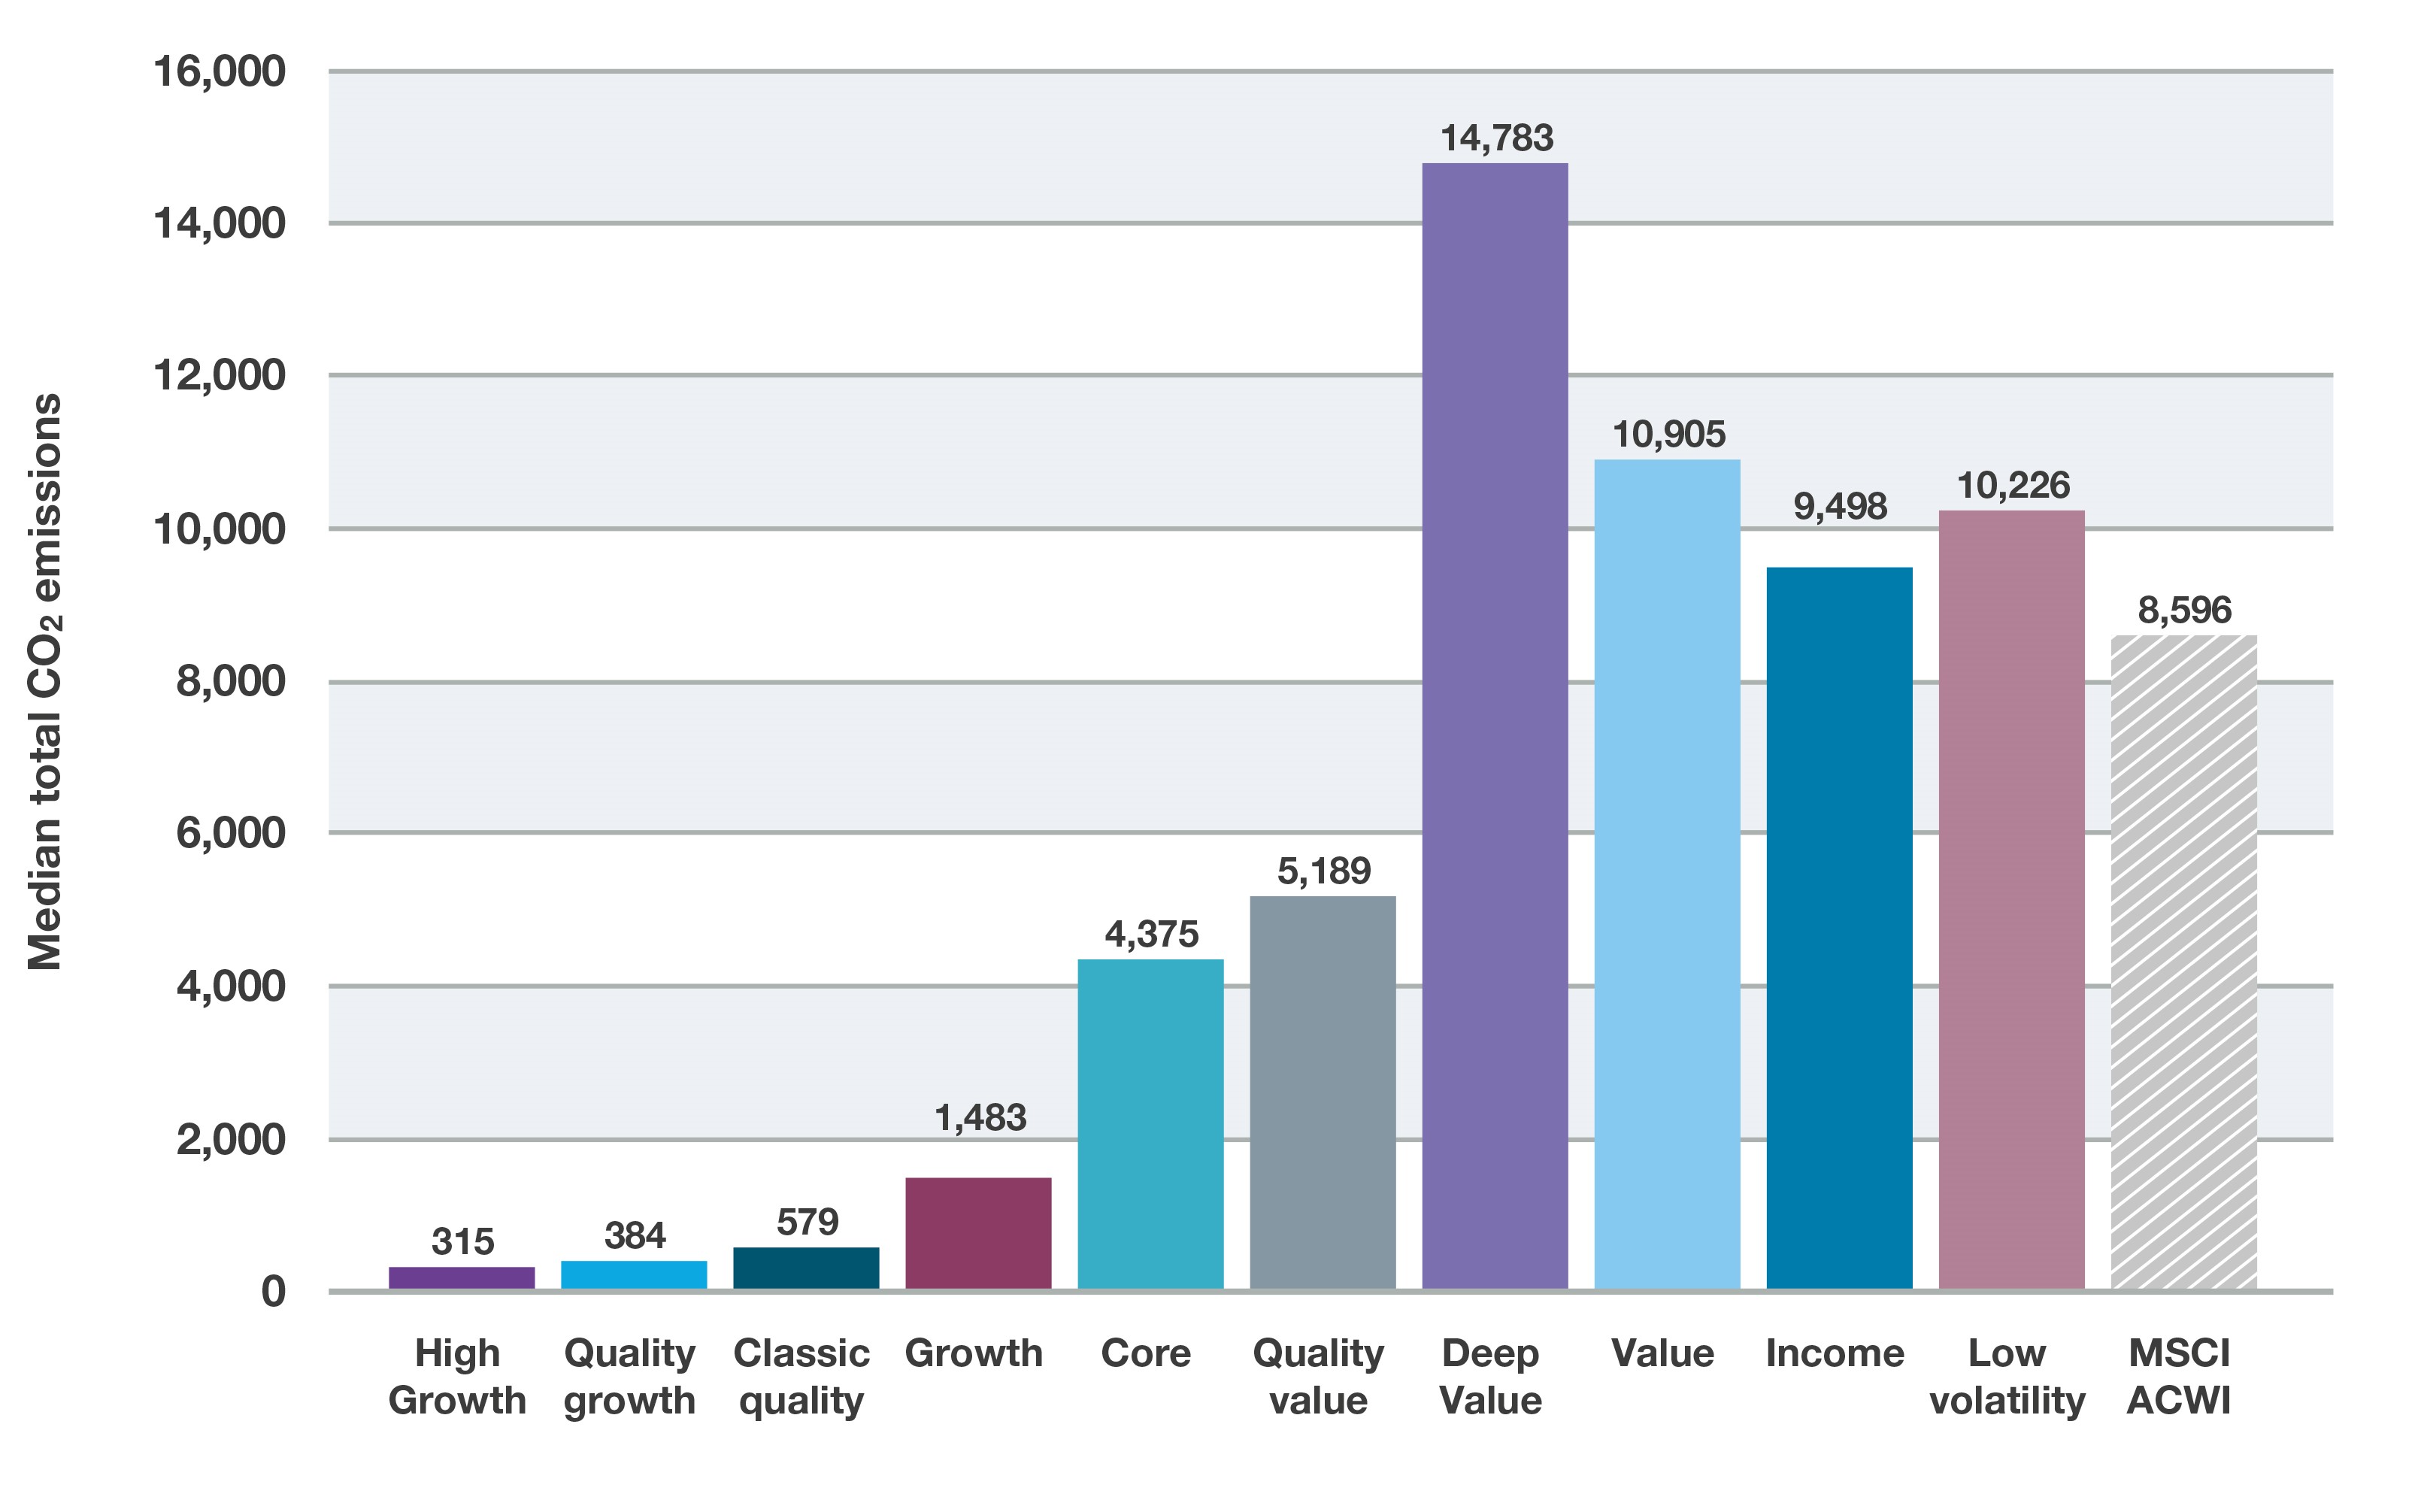
Source: bfinance, Style Analytics, Sustainalytics. bfinance global equity style composites and MSCI ACWI, at March 2022. More detailed discussions of these strategy types can be found in recent white papers: ‘Redefining Value’ and ‘Defensive Equity’.
On the passive side, meanwhile, there are now many low carbon products based on mainstream indices. However, there is no significant universe of strategies offering low carbon approaches in traditional equity styles, such as passive Value equity. Passive low carbon equity strategies also often lack the potential for active engagement that many investors value in this space.
Pitfall 2: Sub-optimal or unintended investment outcomes
There is a case for arguing that investors should not have their sector, style or regional exposures dictated by carbon targets. But implementing in a way that neither affects sector/style/region exposures nor constrains the investment opportunity set is no easy feat. The more aggressive the carbon reduction target (e.g. 70% below benchmark), the more evident the tension becomes.
Depending on an equity manager’s style and approach, a strict target may limit their ability to execute their strategy as intended. It could well increase portfolio concentration or dilute investment conviction. It could certainly result in a significant performance differential between a separate account and the same manager’s pooled fund. This differential can, of course, cut both ways: removing exposure to the ‘worst offenders’ (such as fossil fuel firms) would have been disadvantageous in the first half of 2022, when the Energy sector was up 23% in the MSCI ACWI, but proved beneficial in the first quarter of 2020.
When considering the potential for sub-optimal or unintended outcomes versus mainstream equity investing (without carbon objectives), it is helpful to review the picture of carbon intensity by sector and region. The skews shown in Figures 3 and 4 are well-rehearsed by industry commentators, so the findings should be broadly familiar to readers.
Figure 3: Sector contributions to carbon intensity within the MSCI ACWI (Scope 1 and 2)
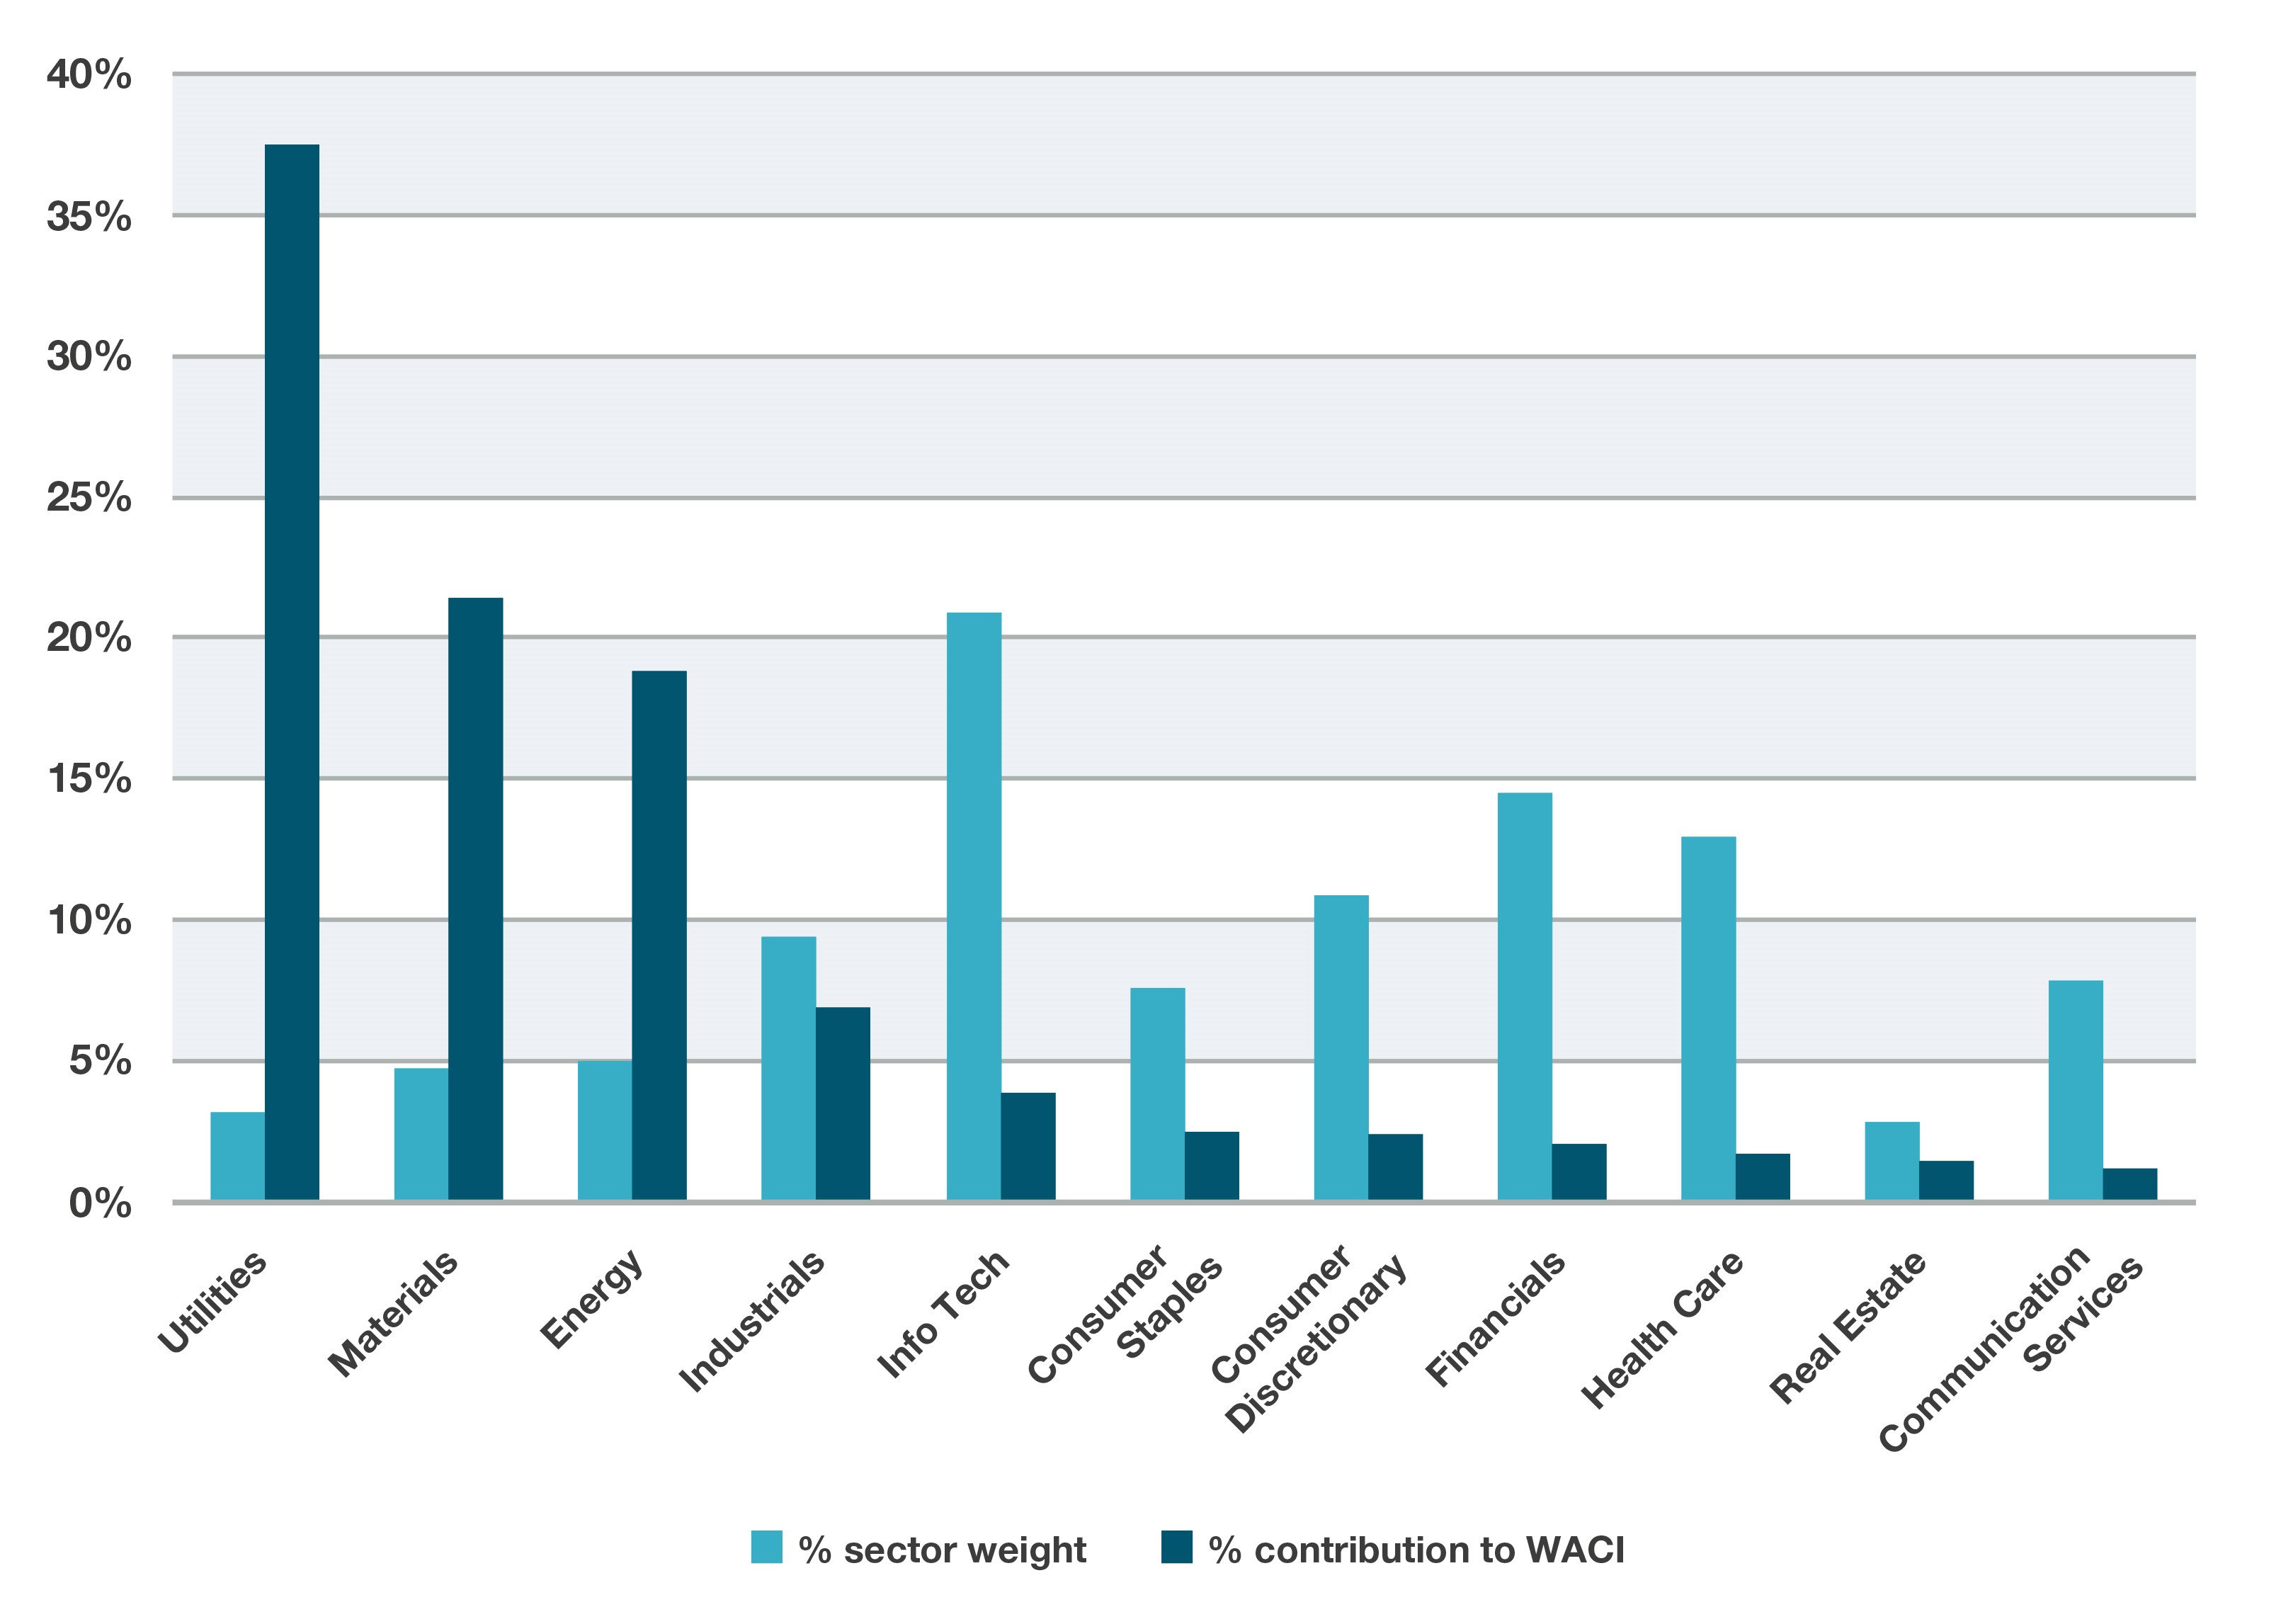
Figure 4: Geographical contributions to carbon intensity within the MSCI ACWI
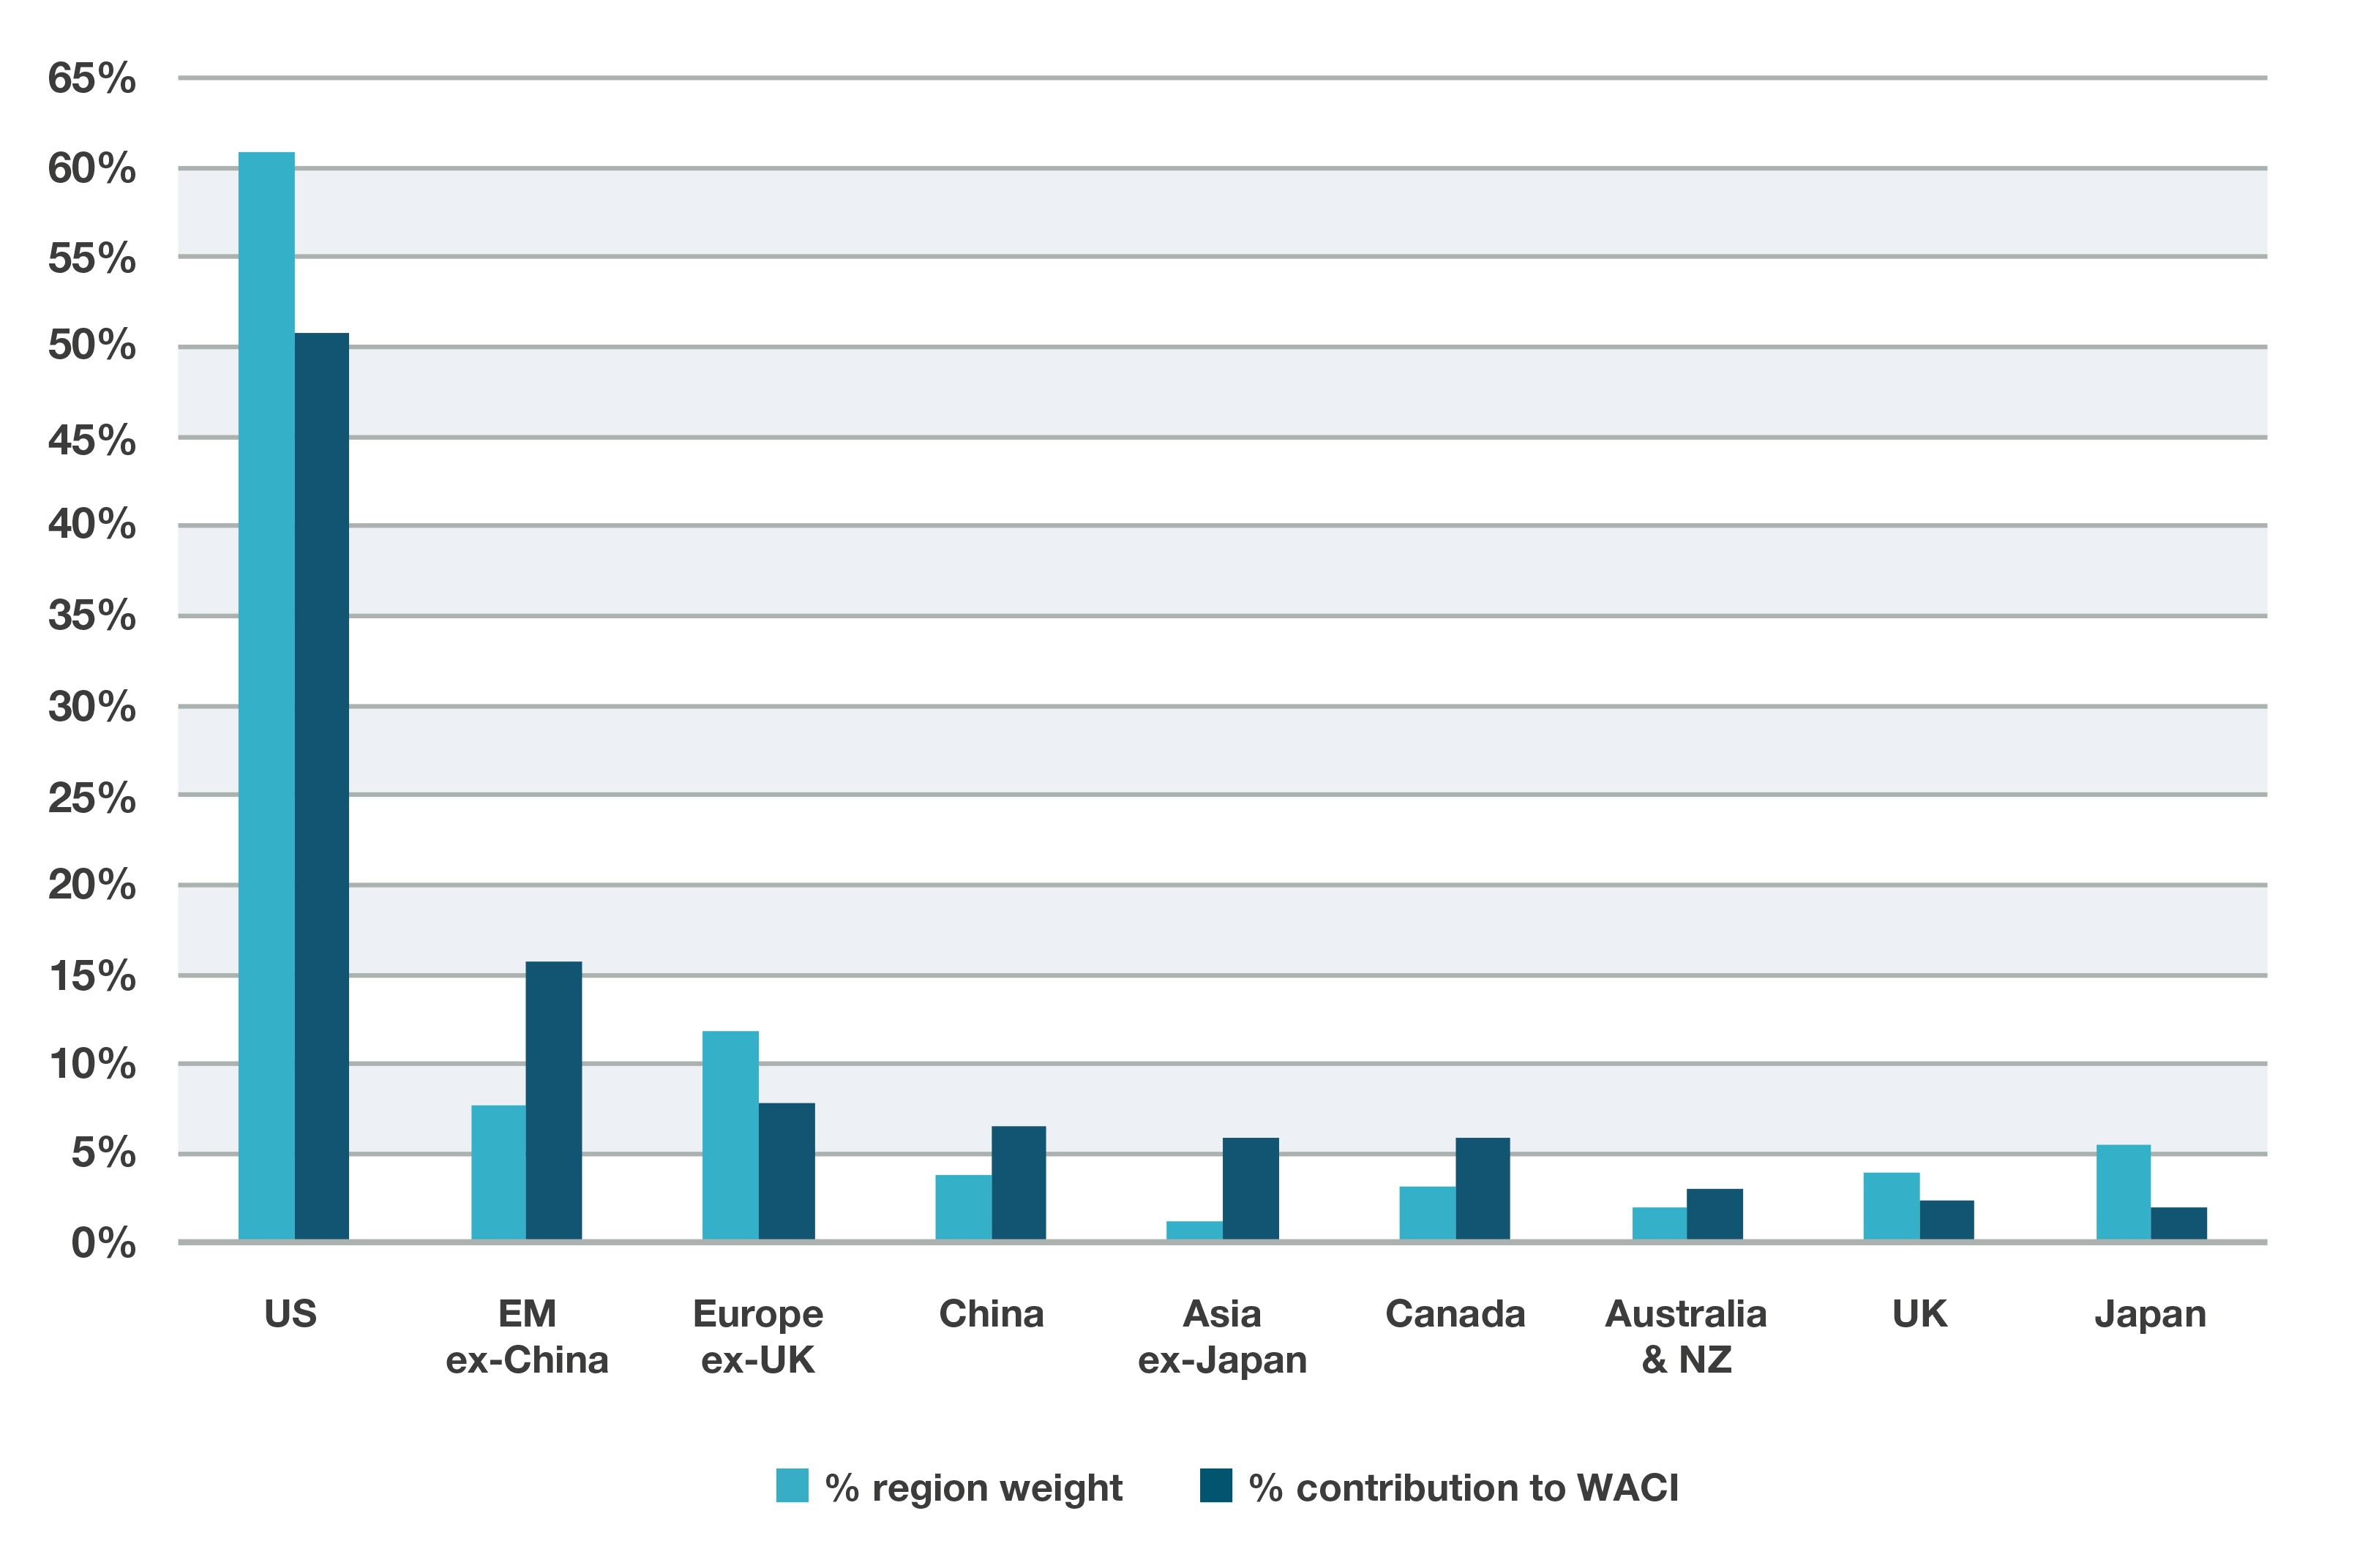
Source: bfinance, MSCI. MSCI ACWI at June 2022, ordered by % contribution to index WACI
It is no surprise to see the WACI of the MSCI ACWI driven primarily by Utilities (mainly Electric Utilities), Materials (especially Chemicals and Construction Materials) and Energy (Oil, Gas and Consumable Fuels). The IT sector appears relatively friendly from a WACI perspective, although if we drill down to an industry level then we see high emissions from Semiconductors and Semiconductor Equipment. On the region side, Emerging Markets, China, Asia and Canada stand out as having a disproportionately high contributions to the WACI versus their index weight, although there are different drivers in play (Energy in Canada, Materials and Utilities in the Emerging Markets ex. China).
When considering these biases, investors should pay careful attention to the (significant) effects that Scope 3 emissions can have on the overall picture. Sectors that appear to make a very light contribution to WACI figures, such as Financials or IT (especially Software as a Service – SAAS), become far more carbon-heavy when Scope 3 is addressed. Apple, for example, may appear to have a low carbon intensity when focusing purely on Scope 1 and 2, but it is one of the main clients of high-emitting chip manufacturer TSMC (Taiwan Semiconductor Manufacturing Company). Scope 3 should not be overlooked, despite the lack of accurate reporting; many regulators are focused on this topic as part of the Net Zero transition.
As Scope 3 data and Scope 3-inclusive WACI figures become more robust, it will become less easy to achieve carbon-cutting targets by simply removing a handful of outsized emitters—even if that is an approach that the investor wants to take.
Pitfall 3: Undermining ‘climate’ objectives
A low carbon footprint today is typically achieved by severely reducing or eliminating exposure to the ‘worst’ emitters. In effect, they are—implicitly or explicitly—exclusionary. As discussed, this approach can affect the investor’s ability to access some strategies, can (at times) lead to relative underperformance and may well be undermined by the growing focus on Scope 3 data.
Yet there is another key reason why this can be problematic. Often, these high emitters are precisely the firms that have the greatest scope for impact. They may be important to new climate-friendly technologies—as is the case for the aforementioned chip manufacturer TSMC. They may have huge potential for reducing direct emissions, as exemplified by Danish power company Ørsted, which has undergone a radical transition from fossil fuels to clean energy. Engaging as a shareholder may allow investors to exercise greater positive influence than they would achieve by simply avoiding these companies.
The potential conflict between a low carbon objective and a climate-aligned objective was discussed in the first instalment of this series (Carbon Cuts or Climate Impact?). Carbon footprints use backward-looking data to provide a snapshot of a portfolio’s current carbon footprint; this is very different from forward-looking climate transition alignment. Seeking a low carbon portfolio today does not necessarily imply any decarbonisation trajectory over time, which will be required to achieve ‘Net Zero’. As an investor, a focus on the climate transition may mean accepting (or even requiring) an optically high carbon footprint today.
In our third article in this series, we will look more closely at this topic, exploring the alignment of equity strategies with the carbon transition.
Key questions for implementation
Above all, the pitfalls discussed in this article reinforce the importance of taking a pragmatic approach in practice. As such, investors may find it helpful to consider the following three questions when deciding whether to take a carbon-reducing approach and how that should be implemented.
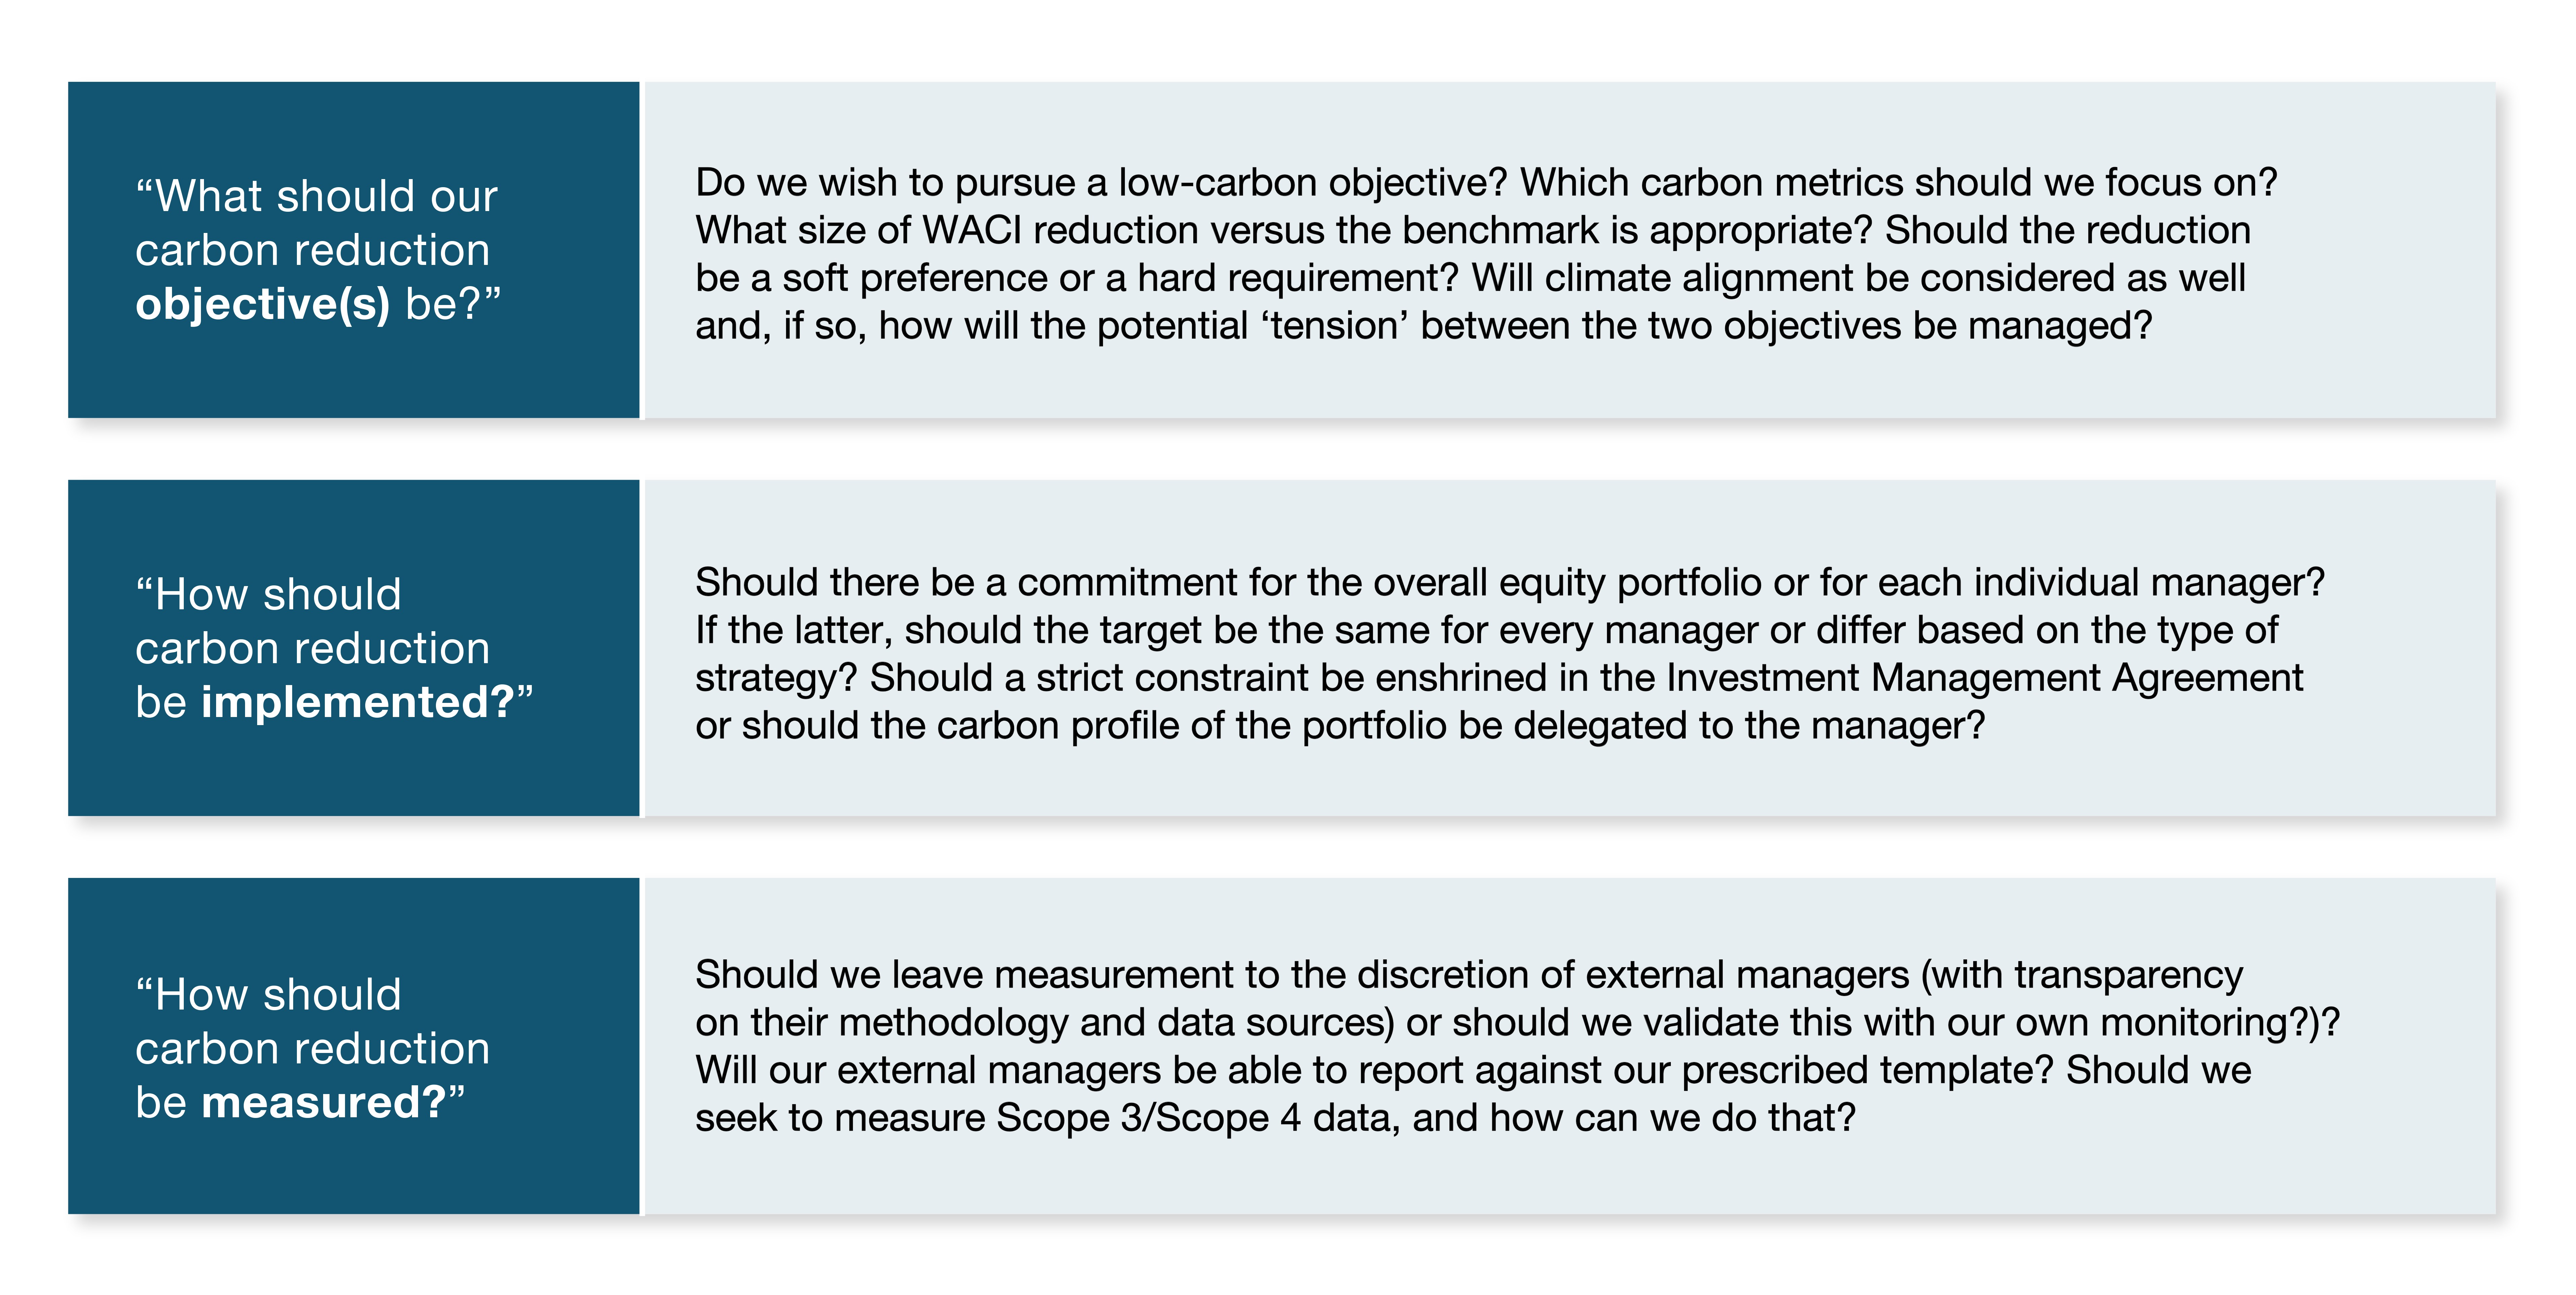
If these questions are raised robustly and addressed with care, carbon reduction can form a highly effective prong of an environmentally responsible investment strategy—without compromising on investment outcomes. The answers may be well complex and nuanced rather than clean and simple. Yet, when it comes to this subject, it is likely better to be ‘roughly right’ than to be ‘precisely wrong’.
Important Notices
This commentary is for institutional investors classified as Professional Clients as per FCA handbook rules COBS 3.5R. It does not constitute investment research, a financial promotion or a recommendation of any instrument, strategy or provider. The accuracy of information obtained from third parties has not been independently verified. Opinions not guarantees: the findings and opinions expressed herein are the intellectual property of bfinance and are subject to change; they are not intended to convey any guarantees as to the future performance of the investment products, asset classes, or capital markets discussed. The value of investments can go down as well as up.


 Français (France)
  Deutsch (DACH)
  Italiano (Italia)
  Dutch (Nederlands)
  English (United States)
  English (Canada)
  French (Canada)

