bfinance insight from:

Duncan Higgs
Managing Director, Portfolio Solutions
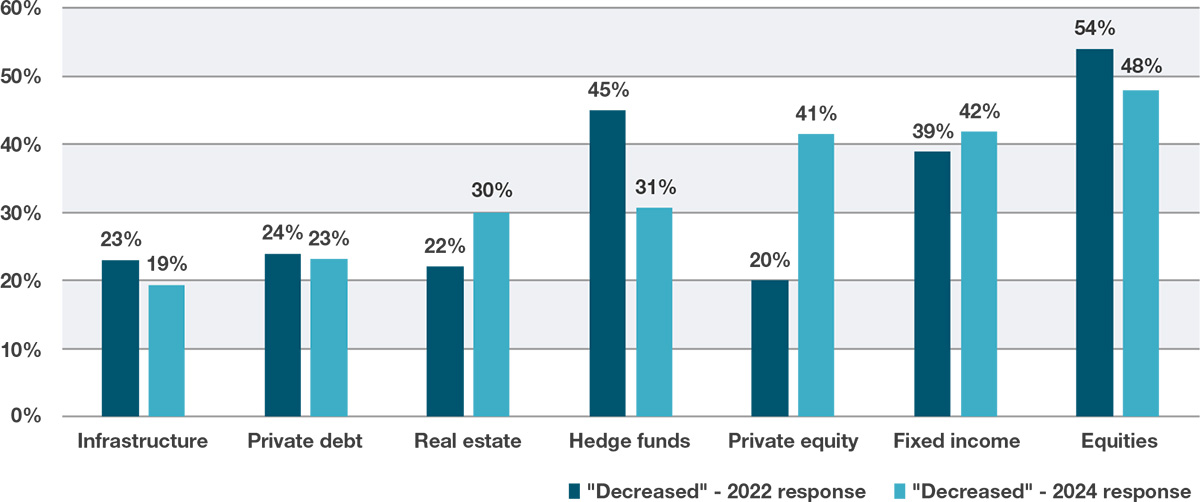
A new survey of more than 300 investors (Global Asset Owner Survey bfinance, November 2024) indicates that more than 40% believe ‘like-for-like’ fees for Private Equity managers have decreased in the past three years. Two years ago, however, the figure was just 20%. With many GPs under pressure amid slower fundraising and reduced investor satisfaction with performance, is now the time to press for better terms?
Figure 1: Investors: Have external asset management costs for ‘like-for-like’ strategies been increasing or decreasing over the past three years?

Source: 2024 bfinance Global Asset Owner Survey and 2022 bfinance Global Asset Owner Survey. Each study contains data from more than 300 institutional investors in >30 countries.
Through the 2010s, private market manager fees remained stubbornly resistant to change. While investors could seek creative ways of improving the cost profile—such as introducing a proportion of direct or co-investment that didn’t involve GP fund expenses—the median base and performance fees in all but a few sectors (such as Direct Lending) did not show meaningful improvement.
This stability contrasted with the measurable price declines across a variety of public market and liquid alternative sectors – as discussed in bfinance’s 2024 Investment Management Fees report. Institutional asset owners and their regulators applied vigorous scrutiny to value for money in the aftermath of a Global Financial Crisis that had wiped a huge amount of value off balance sheets and provoked frustration over the perceived imbalance of risk/reward between asset managers and their clients. In active equity management, firms gave ground amid concerns around outflows (towards passive management, ‘smart beta’ and private markets), with negotiations reinforced by often-mediocre relative performance. Meanwhile, fixed income fees were eroded in a climate of extremely low interest rates. Fund of hedge funds, particularly in Europe, saw considerable price reductions.
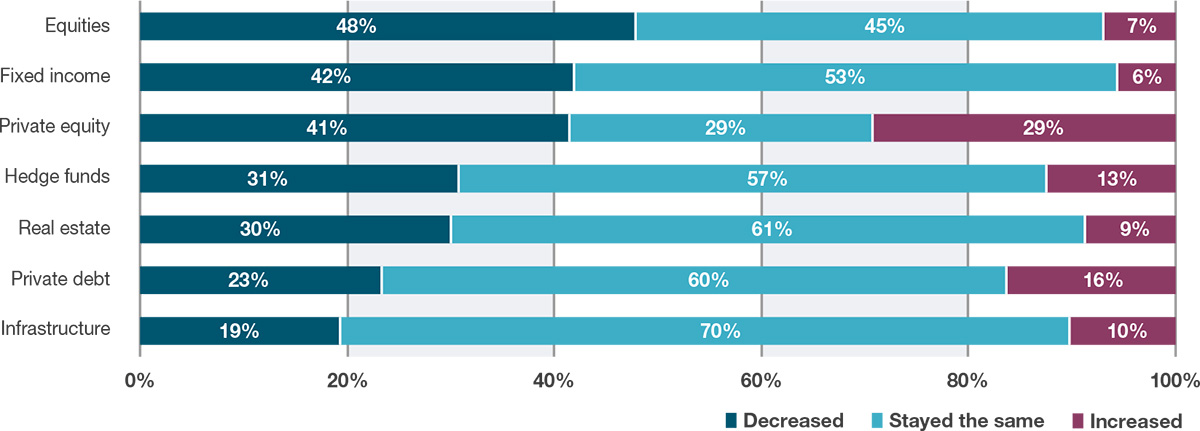
Today, however, there are signs that the picture in private markets may be changing. In the 2024 Global Asset Owner Survey, investors were twice as likely to say that Private Equity fees had declined on a like-for-like basis over the past three years than they had been in the 2022 study (from 20% to 41%). That being said, it’s important to note that more than a quarter in each study said that Private Equity fees had risen. In addition, there was no increase in the proportion of investors indicating that fees had fallen in Infrastructure or Private Debt.
Figure 2: Do you believe that external asset management costs for ‘like-for-like’ strategies in the sectors below have been increasing or decreasing over the past three years?

Interestingly, a mid-2024 report (2024 Preqin Private Capital Fund Terms Advisor) showcased a reduction in the mean management fee for all illiquid asset classes, other than Venture Capital, between 2023 and 2024. It’s worth noting, though, that this study found little-to-no reduction in median fees. The latter figure tends to be more representative of industry norms and investor experience, reducing the effect of outliers (such as a handful of very highly priced or price-undercutting players).
What may be driving perceived price declines? bfinance manager research confirms that recent savings in Private Equity are not necessarily being driven by improvements in headline fund terms: in line with the Preqin research, we also have not seen median pricing meaningfully shifting on a like-for-like basis (with the exception of Real Estate). Yet sources of like-for-like price reduction can come in other forms. One interesting development is greater access to ‘first-close’ discounts: GPs are extending first-close dates more frequently, and indeed are less likely to reach fundraising targets overall, such that an increasing proportion of LPs end up with better terms. Headline fees may be offering one story; actual pricing may tell another.
In focus: hurdle rate debate
Hurdle rates have attracted particular attention in the hedge fund sector in 2024 (Money For Nothing: Hedge Funds Haven’t Budged on Hurdle Rates Yet). For example, a group of allocators led by the Teacher Retirement System of Texas, wrote an open letter to the hedge fund industry calling for cash-based hurdles (Regarding the Usage of Cash Hurdles in Incentive Fee Arrangements).
The argument does have strong relevance in certain illiquid asset classes, most obviously Private Debt. In a 2017 article, for example, bfinance researchers argued that—in general—hurdle rates in Private Debt ought to be no lower than 2% beneath the fund’s expected return if a 100% catch-up is employed (Are Private Debt Managers Lowering the Bar?) The gap between this suggested rule of thumb and current reality, seven years on, is stark.
GPs under pressure?
To a significant extent, we may attribute perceived price reduction to the widely discussed change in the fundraising conditions for private markets managers. In the previous decade, rising demand for illiquid investment strategies made it difficult for buyers to push for better terms. Preqin’s own data on closed-ended funds, for example, indicates that annual capital raising for the four major illiquid asset classes—Private Equity, Private Credit, Private Real Estate and Infrastructure—rose by more than 400% between 2010 and 2021. The 2022-2024 period conversely shows a clear and sustained reduction in the pace of new fundraising, although the amounts remain very high by historic standards and some sectors (Private Debt, for instance) have been less affected than others. As well as placing pricing power in GPs’ hands with respect to fees, this environment also supported an ongoing lack of transparency on additional expenses (see Asset Owner Survey: Investors’ Costs and Fees), notwithstanding the efforts of various bodies to develop clearer reporting templates.
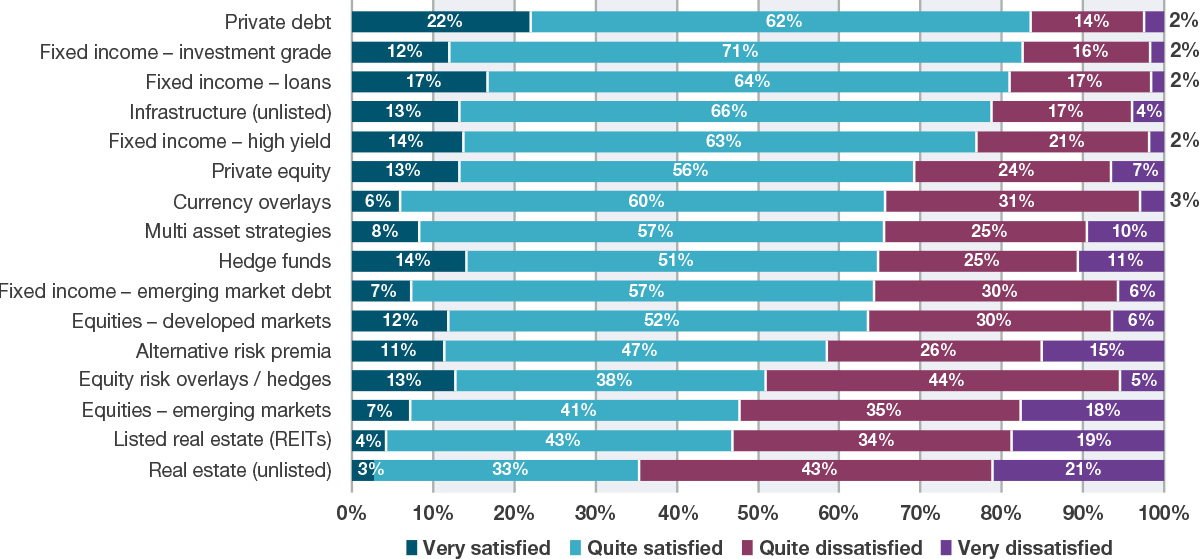
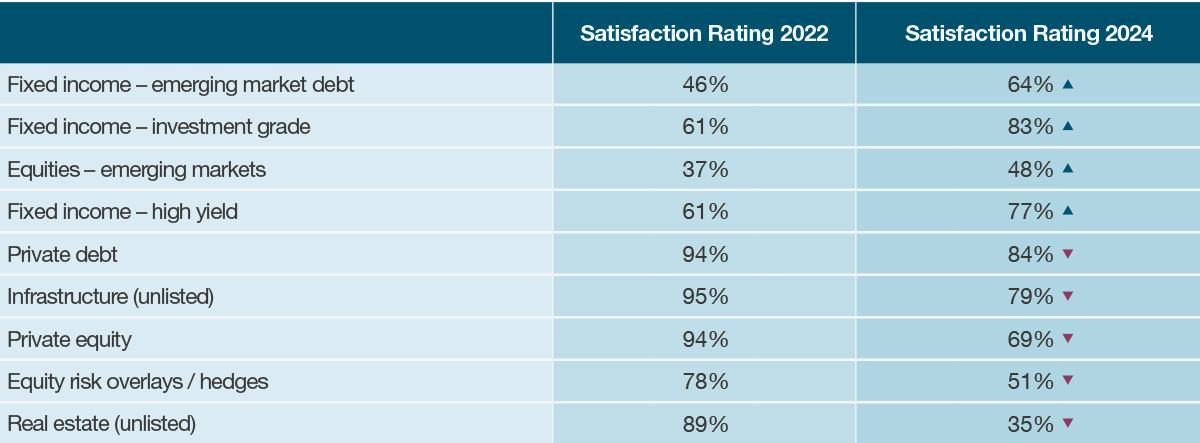
Yet performance—and perceptions of performance—could also be a key factor involved in empowering investors. The aforementioned asset owner survey indicated that 69% of investors are satisfied with the performance of their Private Equity managers in late-2024, dropping from 94% in late-2022. Satisfaction with Infrastructure managers has declined from 95% to 79%, and satisfaction with unlisted Real Estate managers has plummeted from 89% to just 35%. Some of these numbers are still high relative to several public market asset classes, but they are far from the overwhelming endorsement that they once represented. The theme of manager performance was the topic of our recent Private Markets webinar.
Figure 3: Over 2022-2024, how satisfied have you been with the performance of actively managed strategies relative to their benchmarks/targets?

Source: bfinance 2024 Global Asset Owner Survey. Data from 311 investors.
Figure 4: Satisfaction contrast, 2024 versus 2022

Source: bfinance 2024 Global Asset Owner Survey and bfinance 2022 Global Asset Owner Survey. Each study contains data from more than 300 institutional investors. *Satisfaction Rating: score of Very Satisfied + Quite Satisfied. The 2022 score refers to investor satisfaction with active managers’ 2022 performance, per the Global Asset Owner Survey of November 2022. The 2024 score refers to the chart above. Only asset classes with a 10% or greater change in Satisfaction Rating are shown.
Performance concerns in Private Equity go beyond on-paper NAV and IRR figures. The pace of distributions has slowed in the 2020s: a decline in exit activity, delayed sales and a rise in non-traditional exits (continuation funds and GP-led Secondaries) has meant a slower return of cash to investors’ pockets. Asset owner readers who have recently attempted to close positions via LP secondary transactions will likely have encountered first-hand the gap between theoretical value and achievable sale price.
Some similar dynamics—reduced distributions, more ‘unrealised value’ in funds—are also evident in other asset classes. For example, the charts below illustrate the DPI and RVPI (see Jargon Buster below) of closed-ended value-add Infrastructure funds. In Private Debt, meanwhile, greater use of PIK or Synthetic PIK is resulting in a higher proportion of return being deferred, stored up until a future refinancing date or other event.
Figure 5: DPI and RVPI of closed-end value-add infrastructure funds

Source: bfinance manager research. Data collected in mid-2024 (i.e. correct to end-2023).
Jargon buster: DPI and RVPI
Residual value to paid-in (RVPI) is the Net Asset Value (NAV) of a fund's investment portfolio divided by its capital calls at the valuation date. As such, it represents the portion of a fund's value that is as-yet unrealised.
Distributed to Paid-In, or DPI, is the ratio of the total amount of distributions paid out to investors to the total amount of capital they invested in the fund. Also known as the realisation multiple, it represents how much of an investor’s capital has been returned to them.
Indeed, these developments at both ends of the investment timeline—lower-than-expected fundraising and slower-than-expected realised gains—are combining to produce noticeable stress for GPs. On a positive note, every period of stress tends to produce potential opportunities. As well as potential fee improvements, investors can also consider the investment prospects that arise or improve during conditions of greater GP stress, such as NAV financing, GP stakes and semi-liquid funds (whose availability has surged as managers seek to draw new investors, such as liquidity-mindful Wealth Managers).
Figure 6: GP stress and investor opportunity?

Seeking strategies for savings
Although data suggest that it may be too early to expect any obvious price declines in high-cost private market asset classes, we should examine the potential for improved value for money. Investors can lay the foundations for success here by seeking a clearer understanding of total manager costs (fee and non-fee, including the retesting of waterfall structures), in the knowledge that this subject is a complex one and effective benchmarking is hard to come by. Moreover the ability to achieve advantageous terms may depend on the preferred GPs’ own conditions, fundraising timings and other factors.
While cost should not, of course, be the only consideration in a manager selection decision, better terms can make a very sizeable difference to investors’ asset class outcomes – and a significant improvement to an institution’s overall bottom line in a world where 25-40% allocations to private market strategies are now commonplace.
Important Notices
This commentary is for institutional investors classified as Professional Clients as per FCA handbook rules COBS 3.5R. It does not constitute investment research, a financial promotion or a recommendation of any instrument, strategy or provider. The accuracy of information obtained from third parties has not been independently verified. Opinions not guarantees: the findings and opinions expressed herein are the intellectual property of bfinance and are subject to change; they are not intended to convey any guarantees as to the future performance of the investment products, asset classes, or capital markets discussed. The value of investments can go down as well as up.


 English (Global)
  Deutsch (DACH)
  Italiano (Italia)
  Dutch (Nederlands)
  English (United States)
  English (Canada)
  French (Canada)

