bfinance insight from:

Robert Doyle
Senior Associate, Public Markets, Equities Specialist
In what is rapidly proving to be annus horribilis for emerging market equities, October brought the most painful month of the year so far as the MSCI Emerging Markets index fell by 8.7% in USD terms, taking the overall YTD slide to -15.7%.
Yet the median active manager appears to have done even worse, losing a further 2% YTD net of standard management fees.
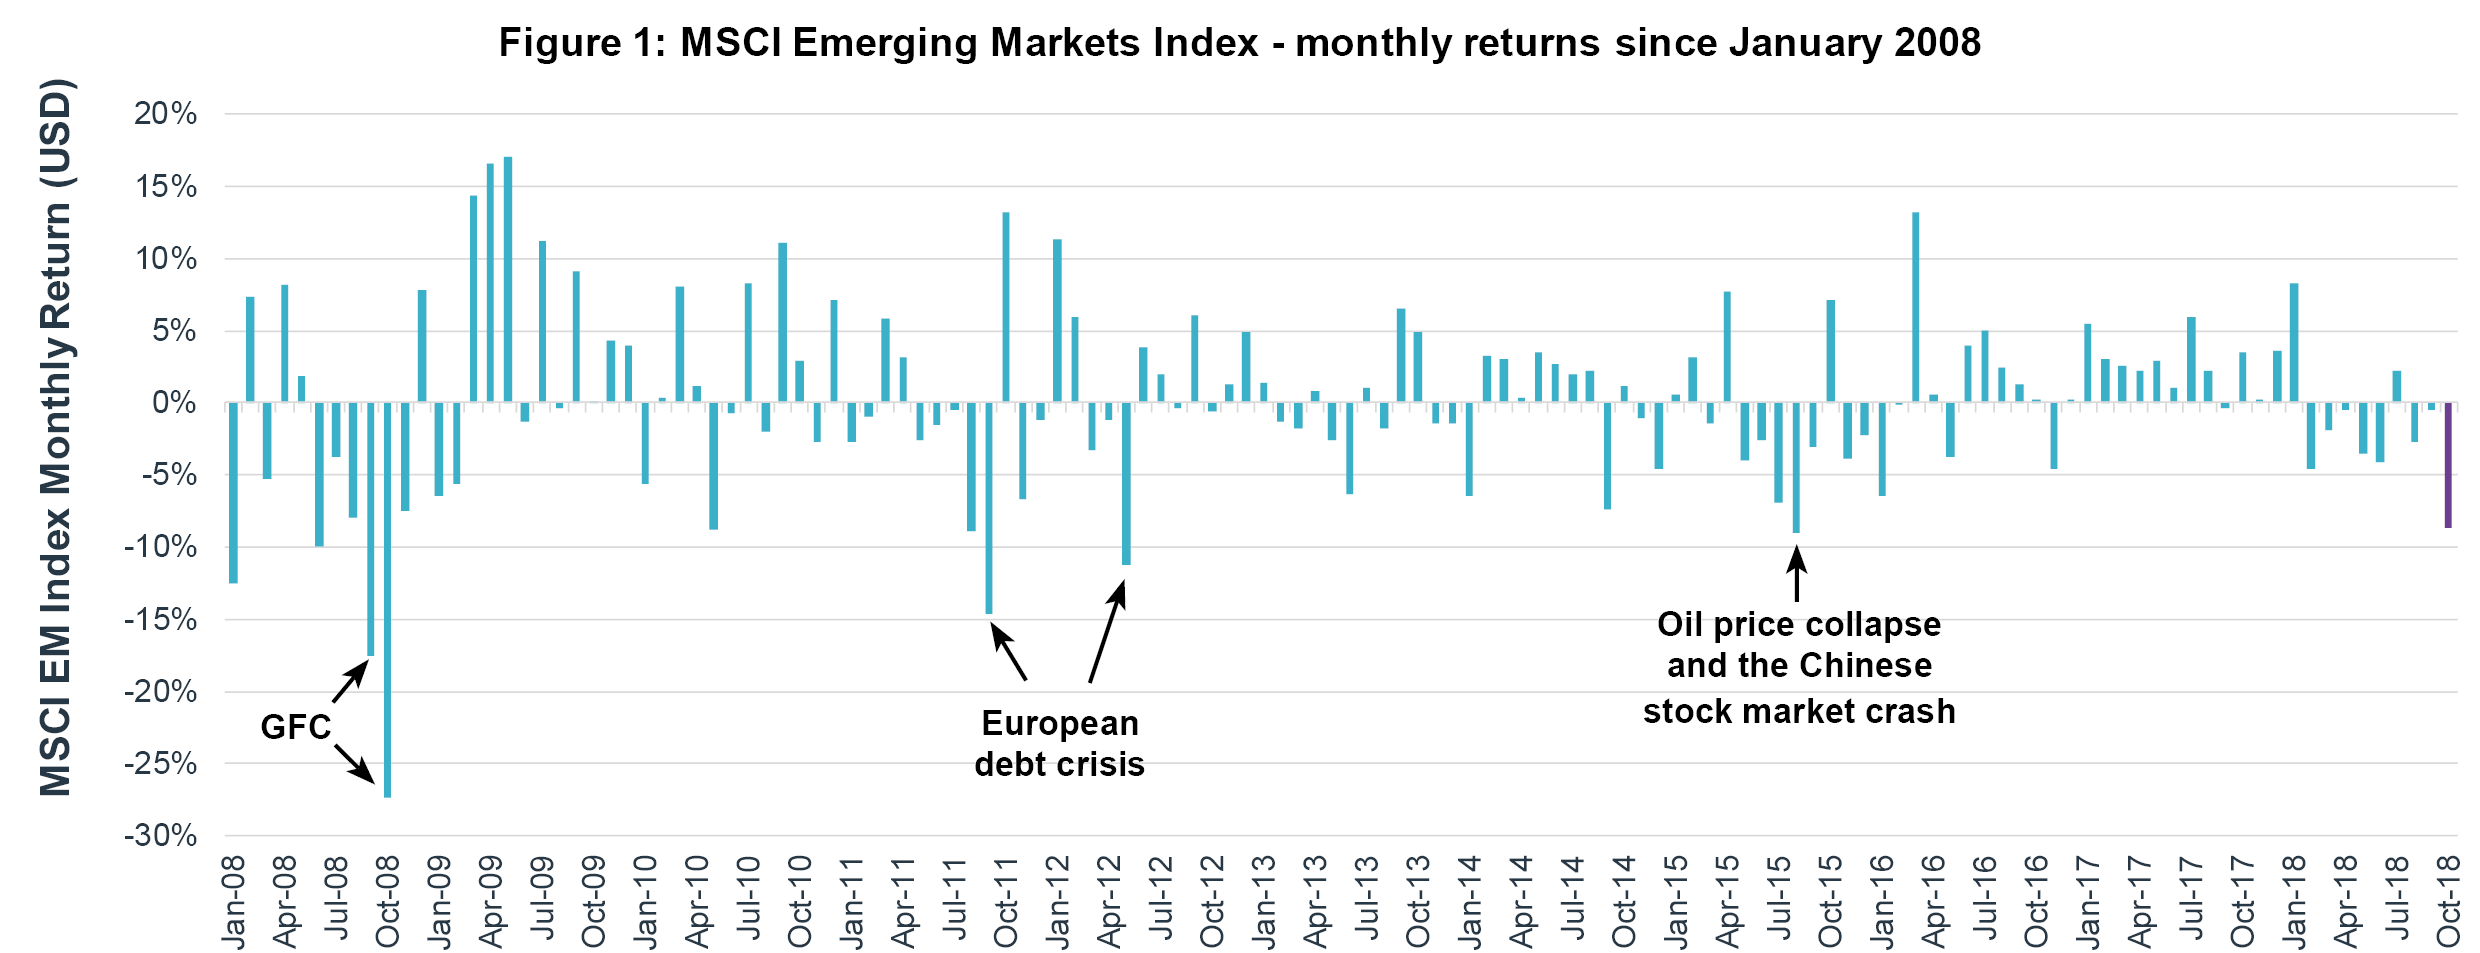
After two strong years for EM equities, which rose more than 50% through 2016-17, 2018 has brought a harsh reversal of fortunes and last month proved particularly brutal. In itself, the loss borne by the index in October was not particularly unusual by historical standards. Since January 2008 there have been nine months where the MSCI EM index has delivered a worse return. Yet what was somewhat abnormal was the obvious trigger for October’s fall, or, rather, the lack of one.

Previous months of significant decline were generally predicated on clear crises: the global financial crisis of 2008, flashpoints in the European debt crisis (September 2011, May 2012), or the simultaneous oil price collapse and Chinese stock market crash of August 2015. October’s sell-off appeared to have several less explicit – and less contained – triggers. Its roots were predominantly in the US, where another strong economic growth report increased the likelihood of faster-than-expected interest rate hikes, dampening prospective global economic growth, with a backdrop of further protectionist rhetoric in US-China trade relations. The MSCI World index of developed markets fell 7.4% in USD terms in October, recording its worst monthly return since May 2012, with technology stocks suffering particularly sharp falls on the back of weaker-than-expected earnings releases from sector heavyweights Amazon and Alphabet.
Investors across both developed and emerging markets are evidently concerned about lofty valuations and the sustainability of earnings. Yet emerging market stocks have been particularly badly hit, as is often the case in periods of sharp US dollar strength.
Are the more defensive strategies proving their worth now
Amid this evident turmoil, how have active managers weathered the storm? Are the more defensive value- and income-oriented strategies, which generally lagged through the banner years of 2016 and 2017, now proving their worth? And is the increasingly popular “quality growth” style actually delivering protection?
STYLE MATTERS
If this has been a sobering year-to-date for emerging market equities, the post-party comedown has been even worse for the average active manager. The median return (-17.7% net of fees) is 200bps lower than the MSCI Emerging Markets index. In fact, delivering outperformance of just 50bps (i.e. a loss of only 15.2%) would have been enough to place a manager in the “top quartile” of performers. In October – the worst month for the index – the median manager fell almost exactly in line with the market.
Figure 2: Active manager returns vs MSCI EM index
Source: FE Analytics. Data in USD using representative share classes, net of standard management fees.
Yet these averages mask a wide range of results. There are almost thirty percentage points between the worst and best performers, with the former losing nearly 30% of value and the latter virtually flat for the year (net of fees). Further analysis of the manager universe shows that investment style has been a key determinant of relative returns, both in October and for the year to date. In Figure 3, we have categorised managers according to our own qualitative and quantitative assessment of their preferred styles.
Figure 2: Active manager returns vs MSCI EM index
Source: FE Analytics. Style Analytics, bfinance assessment Data in USD using representative share classes.
Here we see very clearly that growth characteristics, which were a positive tailwind through recent years, have proven a strong headwind in 2018. These managers have lost an average of 6.8% versus the index, or 22.5% overall (net of fees). This was also evident in October, with the broad sell-off in the technology sector bringing particular pain to the growth style.
Even those growth managers with a quality tilt didn’t fare much better. Given the relative strength of growth stocks in recent years, it is perhaps unsurprising to see these same companies giving up the most ground this year, with high momentum names often the easiest sells when looking to take profits and/or reduce market exposure. However, had October’s sell-off been linked to some form of crisis, triggering a “flight to safety,” it seems likely that we would have seen stronger relative performance from managers with a quality bias.
At the other end of the spectrum, managers with an income focus have performed well YTD and in October, evidencing their more defensive profile. Those with a value tilt have also added value in a market where investors, faced with the prospect of slowing global growth, have been paying particularly close attention to valuation.
A smoother ride?
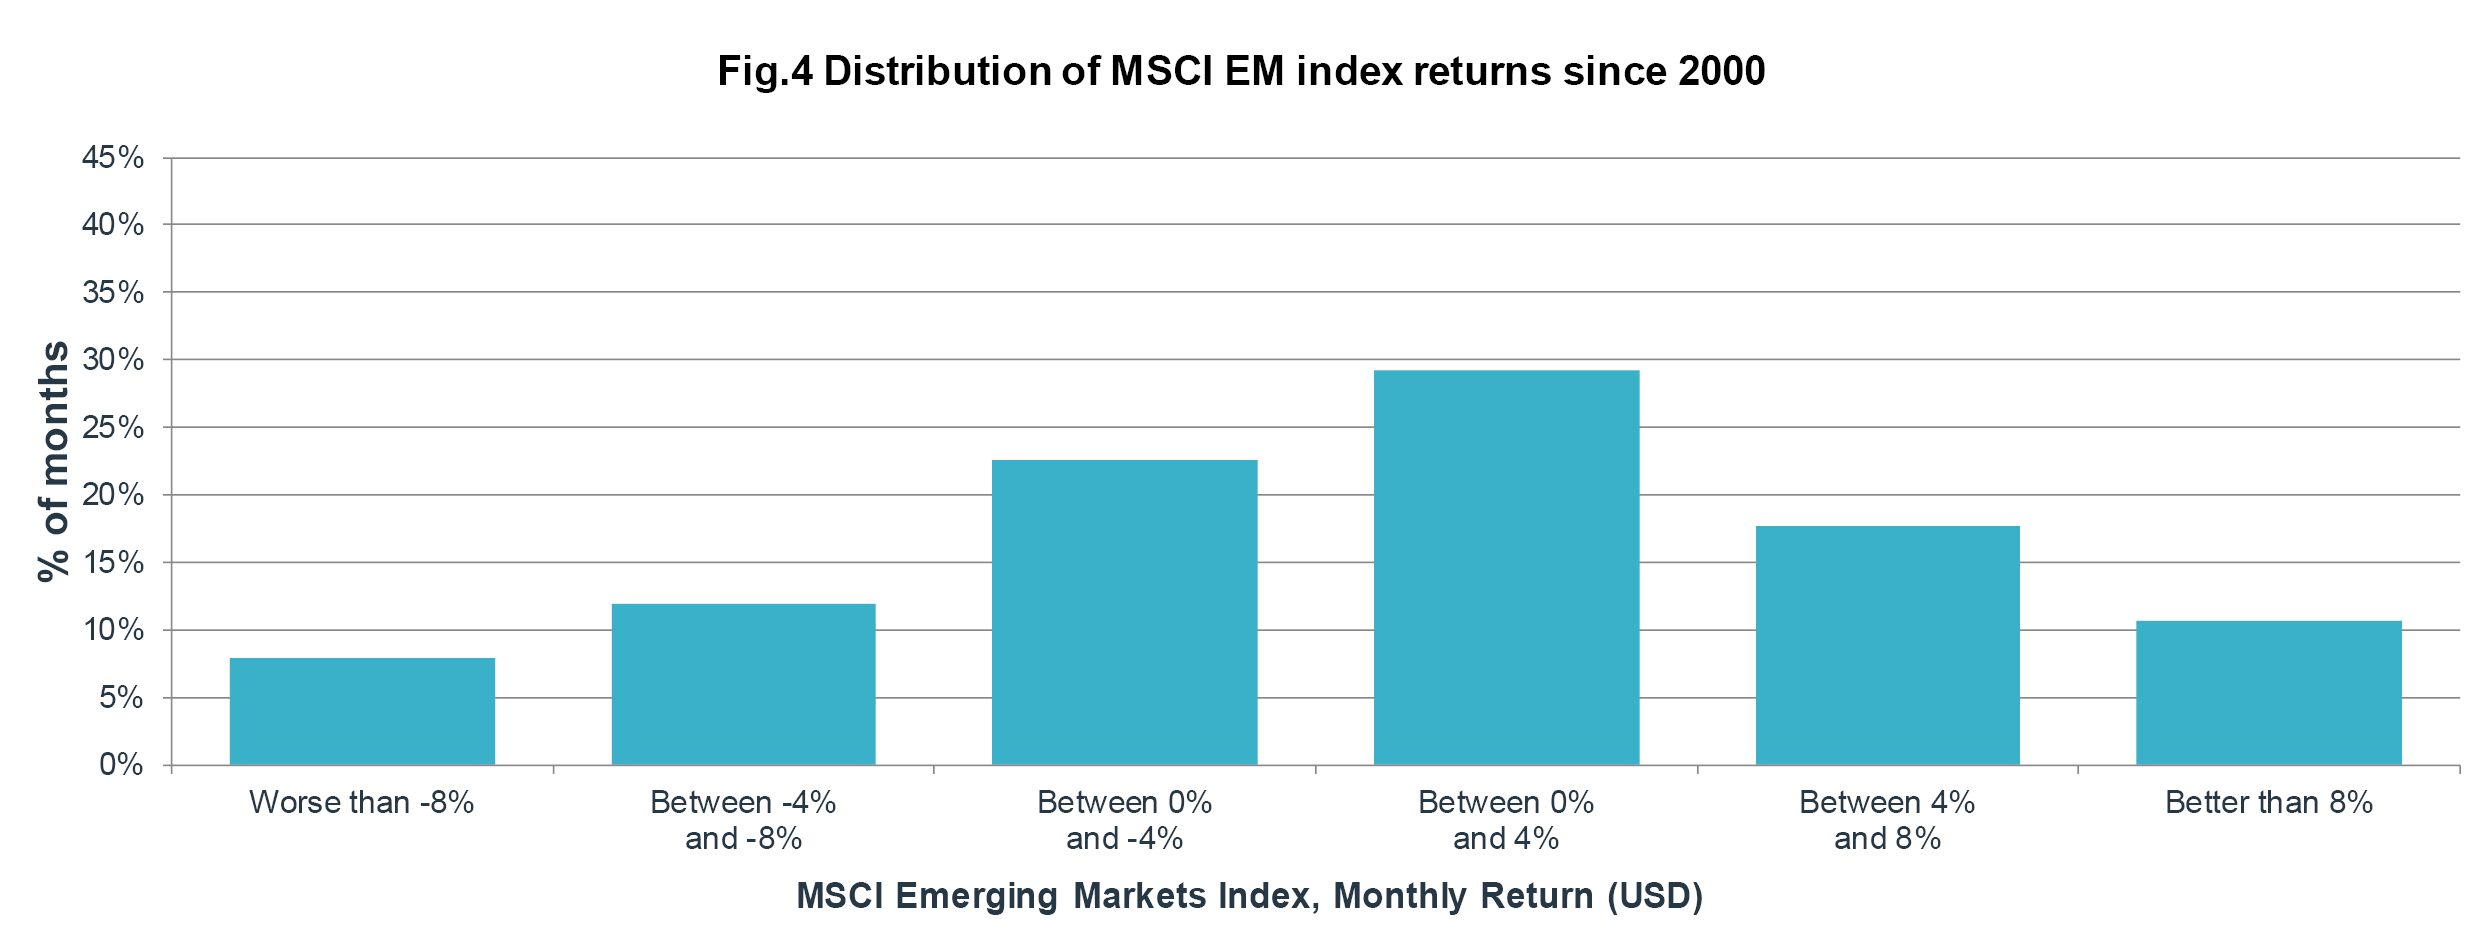
While acknowledging the recent turmoil, it is also important to note that extremes of this magnitude are proving increasingly infrequent in emerging market equities. As Figure 4 illustrates, 19% of all months since 2000 – nearly one in five – have brought returns that were either higher than 8% or lower than -8%. Yet the picture becomes considerably smoother when we examine the last five years.

Source: eVestment
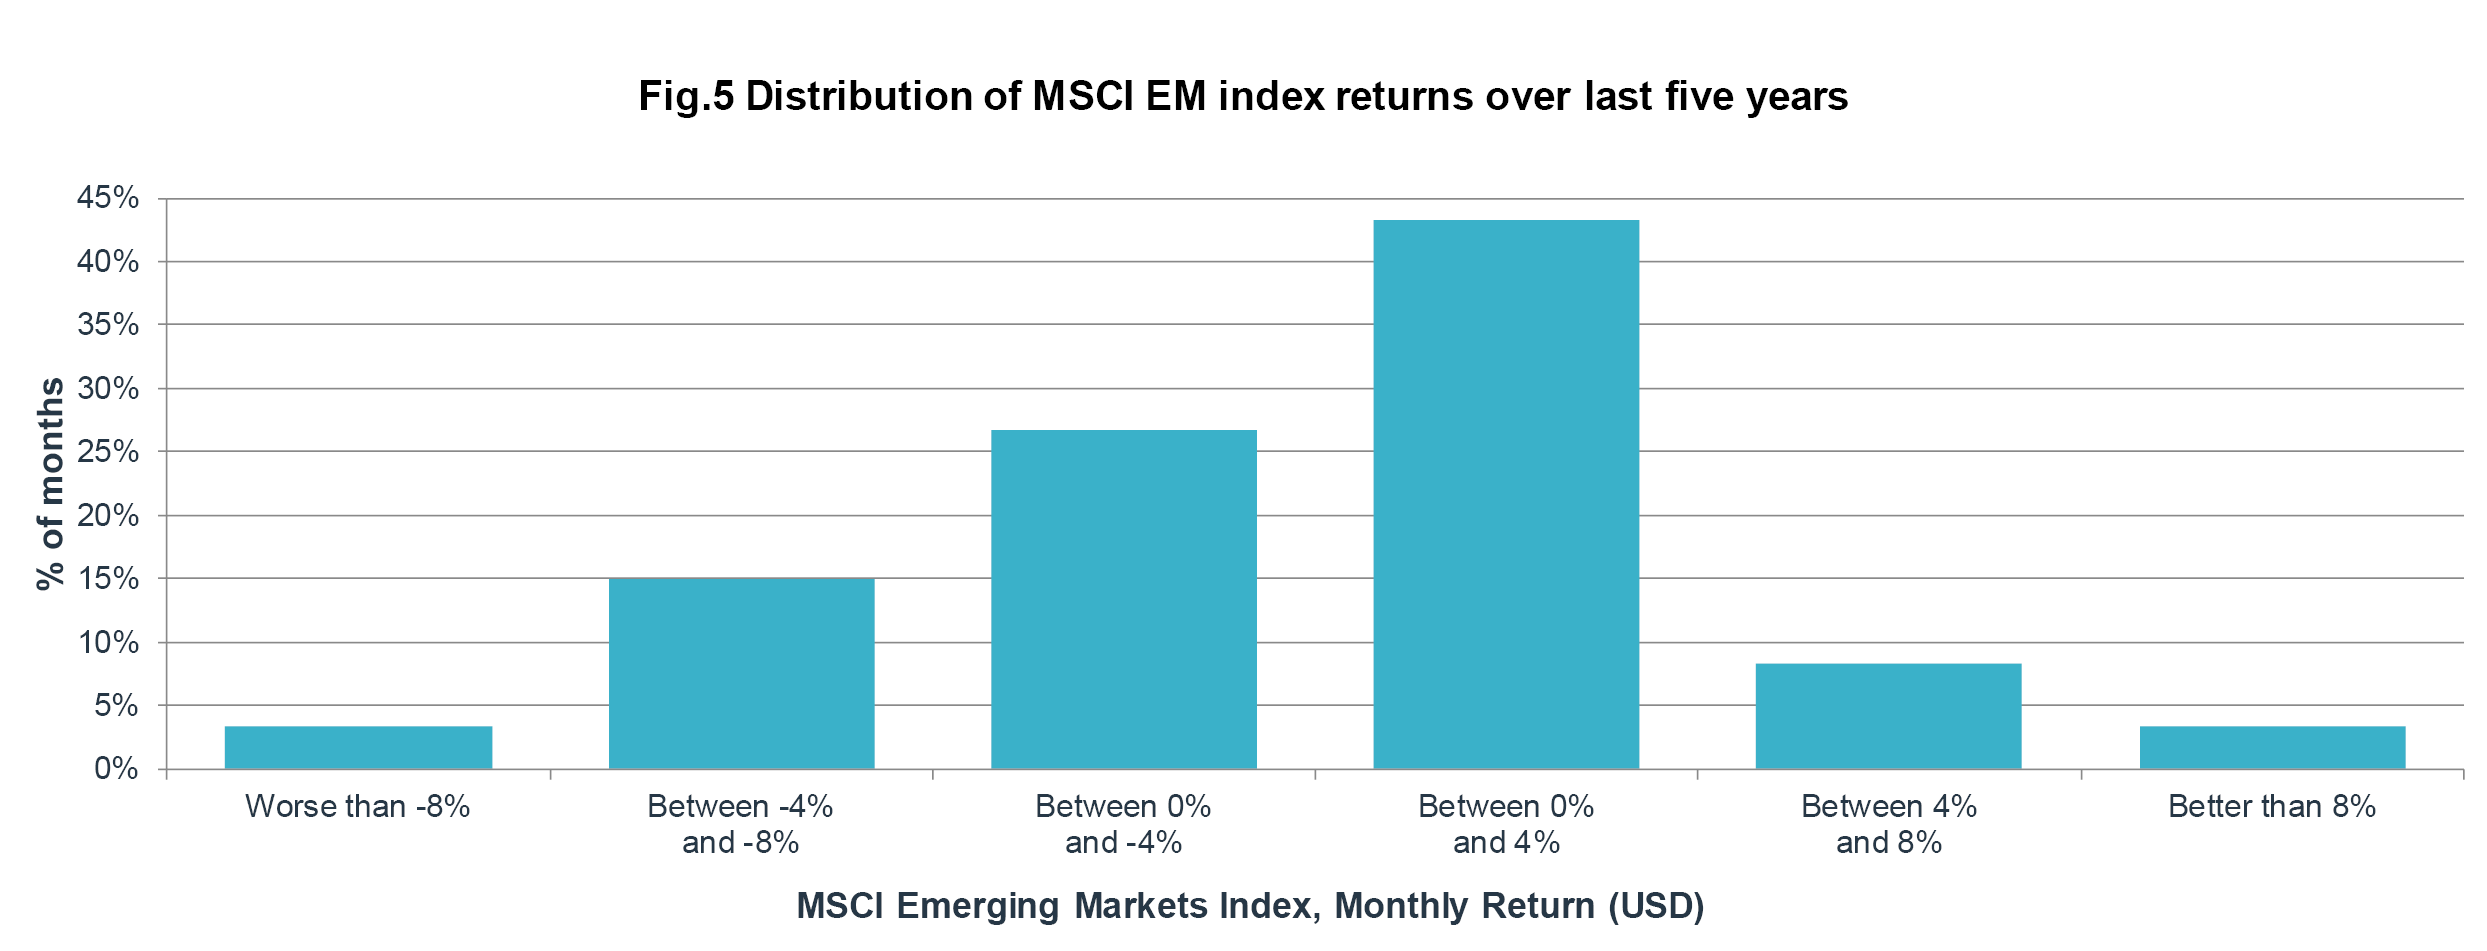
Between 2013 and 2018, the proportion of extreme months is significantly lower, with only 6% of months delivering returns at the very high or low end.

Source: eVestment
Declining levels of extreme volatility could suggest that EM equity as an asset class has evolved to a more stable footing. It’s has changed over the last decade: these markets have become more liquid and accessible, as well as less closely linked to commodity process and highly cyclical industries. Although changing dynamics may offer little consolation amid sharp short-term declines, arguably they are positive for the health of EM equity investing over the long-term.
Important Notices
This commentary is for institutional investors classified as Professional Clients as per FCA handbook rules COBS 3.5R. It does not constitute investment research, a financial promotion or a recommendation of any instrument, strategy or provider. The accuracy of information obtained from third parties has not been independently verified. Opinions not guarantees: the findings and opinions expressed herein are the intellectual property of bfinance and are subject to change; they are not intended to convey any guarantees as to the future performance of the investment products, asset classes, or capital markets discussed. The value of investments can go down as well as up.


 English (Global)
  Deutsch (DACH)
  Italiano (Italia)
  Dutch (Nederlands)
  English (United States)
  English (Canada)
  French (Canada)

